
The best early failure indicators are often not measured directly by any instrument: they are computed from values the bench already has. A derived measurement is one of these computed values recorded as a normal measurement, with its own name, unit, and limits.
Once recorded, a derived measurement behaves like any other: it appears in measurement control, gets a control chart and Cpk, can carry validators, exports to CSV, and participates in drift alerts. A value that only exists inside a spreadsheet formula does none of that.
Prerequisites
- A test procedure that records at least two related measurements in one phase
Step 1: Compute the value in the phase
Derive the value right where the raw measurements are taken, and record it in the same phase:
drops = {}for contact in ["A1", "A2", "A3"]: mv = dmm.measure_dc_millivolts(contact) drops[contact] = mvmeasurements.contact_drop_a1 = drops["A1"]measurements.contact_drop_a2 = drops["A2"]measurements.contact_drop_a3 = drops["A3"]# Derived: imbalance between poles, a better early indicator# than any single pole against its own limit.measurements.contact_drop_spread = round(max(drops.values()) - min(drops.values()), 2)Step 2: Give it a limit
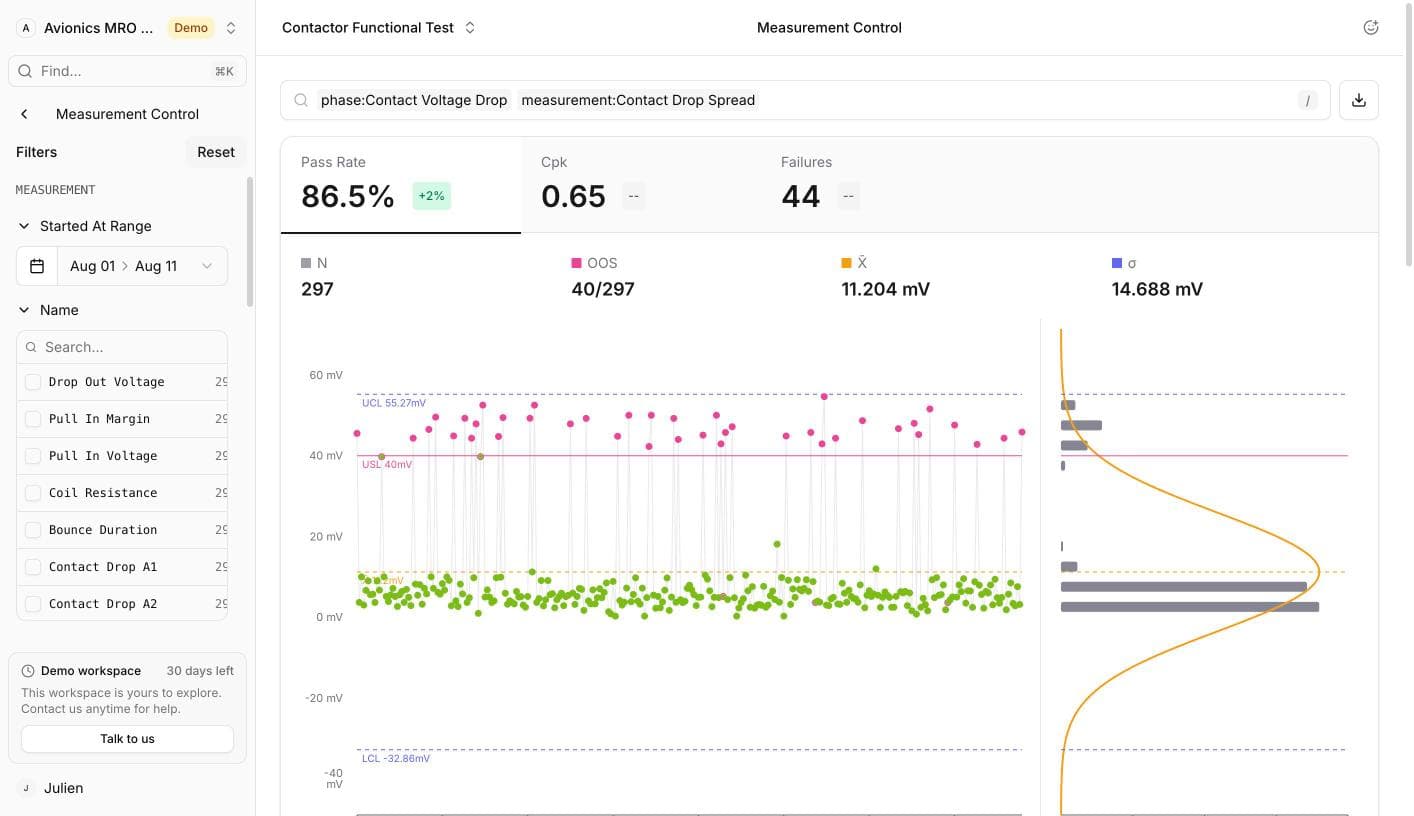
A derived measurement earns its keep when it carries its own validator. In the example, each pole has a 100 mV limit, and the spread gets a 40 mV limit. A unit can pass all three pole limits and still fail on spread, which is exactly the class of defect the individual limits cannot see.
Set the limit from fleet data, not intuition: record the measurement without a validator first, look at the healthy distribution in measurement control, and place the limit outside it.
Step 3: Pick derivations that expose failure modes
Useful patterns:
| Derivation | Computation | What it exposes |
|---|---|---|
| Spread | max - min across channels | One degrading channel among nominally identical ones |
| Margin | limit - measured value | Erosion of headroom before any limit fails |
| Ratio | value A / value B | Shifts that scale both values but change their relationship |
| Delta from reference | value - golden sample value | Fixture or instrument drift |
| Symmetry | left - right, or phase-to-phase | Mechanical or winding asymmetry |
Step 4: Analyze at fleet level
Open measurement control and select the derived measurement over the full history. A healthy fleet is one population; a defect mode shows up as a second one:
From there the standard tools apply: control chart, histogram, Cpk, per-serial scoping, and CSV export for anything you want to take further.