
Get the complete source, dependencies and setup instructions from the template repository.
Open the source on GitHubIntroduction
Server L10 Overview
A server reaches the end of its integrator's line as an L10 unit: the chassis with its motherboard (L6), the CPUs, DIMMs, drives and adapters installed (L7 to L9), a BMC that answers on its management port, and an operating system it can boot. The OCP liquid-cooling integration and logistics white paper defines the levels: L6 is the board in a chassis with no I/O, L6 to L9 add the cards, drives, CPUs and memory, L10 is the unit that boots an OS and receives the final witness test, L11 is the rack with its network and manifold, L12 the rack with its software environment. The L10 test is the last time the server is seen alone, with every part reachable, before it is racked and cabled into an L11 where a DIMM that corrects errors or a drive on a x2 link becomes one node in a cluster that is slow for a reason nobody can name.
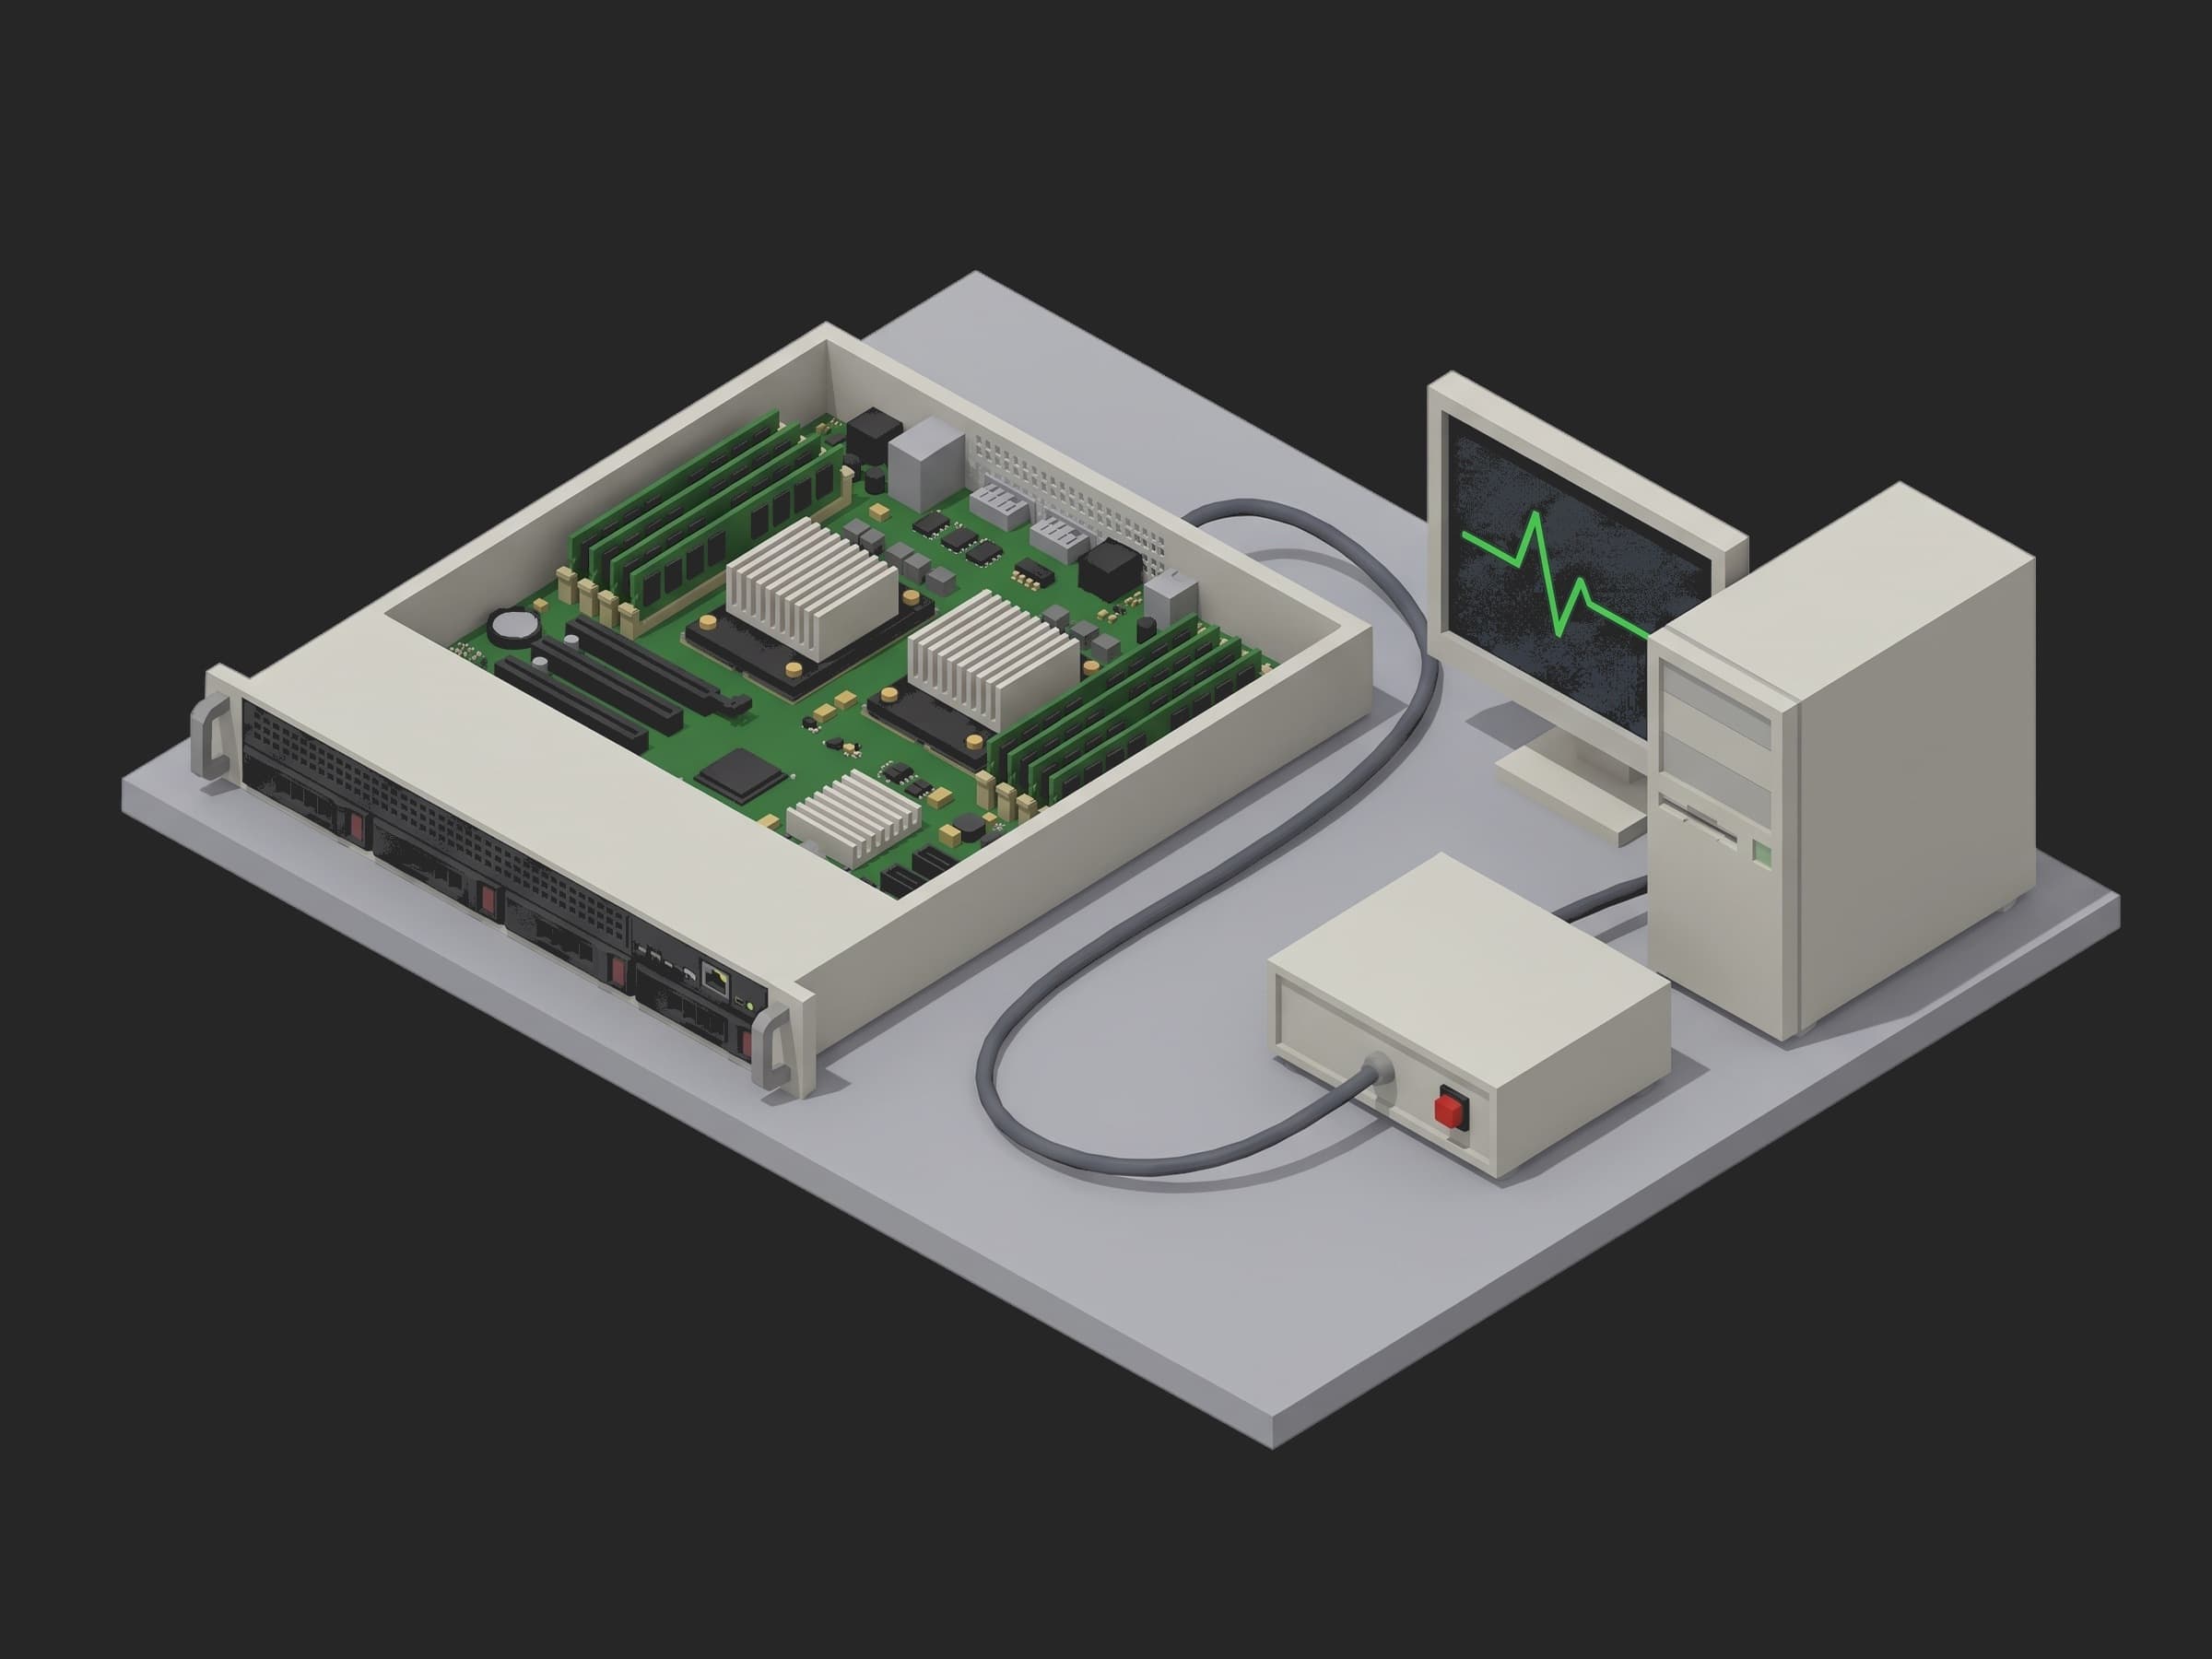
The parts this test exercises: the BMC and the firmware set it reports, the two CPUs and their heatsinks, the 32 DIMMs and the 16 channels behind them, the 8 NVMe drives and the 2 network adapters with the PCIe links they trained on, the fans and the power supplies under a 24 h soak at the chamber's 40 °C.
No public standard sets an L10 pass mark. The content is integrator practice, described the same way by AI Data Center Guide's system-integration chapter and by the job postings that hire for it: BMC and Redfish inventory against a golden configuration, a memory test, PCIe link width and generation, NIC loopback, a thermal soak at the power limit, and a run-in of 24 to 72 hours at elevated ambient with no normative number behind it. Supermicro's rack services brochure calls its version sBurn and rBurn; a Jabil test-engineering posting asks for L10 server and L11 rack procedures and reports first-pass yield on them. What the tools define is the method, not the limit: MemTest86's test descriptions for the memory patterns (moving inversions, walking ones and zeros, modulo-X, bit fade, row hammer), SNIA PTS-E for the SSD steady state (purge, preconditioning at twice the capacity in 128 KiB sequential writes, five rounds inside a 20 % window), and the OCP Datacenter NVMe SSD specification v2.6 for the SMART fields, including the PLP capacitor health of the extended SMART log C0h. Every limit in this template is this line's, and the table below says where each one comes from.
Test Purpose
The procedure records one L10 fingerprint per server:
- BMC reachable, firmware set, processors as whole objects against the golden configuration, the DIMM, NVMe and NIC counts, the total memory and the slowest DIMM speed, and the SEL cleared before the first test
- Negotiated PCIe generation and width of every NIC and every NVMe drive, judged on the worst device per class, and the AER correctable count
- MemTest86 bit errors, correctable and uncorrectable ECC per DIMM, and a STREAM triad at rising thread counts against a floor
- fio preconditioning as an executable phase judged on its exit code, then 4 KiB random read IOPS and 128 KiB sequential MB/s per drive at steady state, and SMART media errors, percentage used and capacitor health per drive
- Frames sent, lost and FCS errors on both 100 GbE ports through loopback plugs, and the link state of both ports as one object
- Package power per socket against the TDP, the hottest core, the fan duty at the end and the throttle counter over 10 minutes of all-core load
- The 24 h run-in trace at 40 °C inlet, and the ECC and media-error deltas per DIMM and per drive against what the earlier phases recorded, with the SEL, throttle and PSU redundancy counters
- At teardown, the SEL cleared again, the BIOS checksum and boot configuration of the shipping profile, the MAC addresses and part serials in the unit's metadata, and the Redfish inventory attached
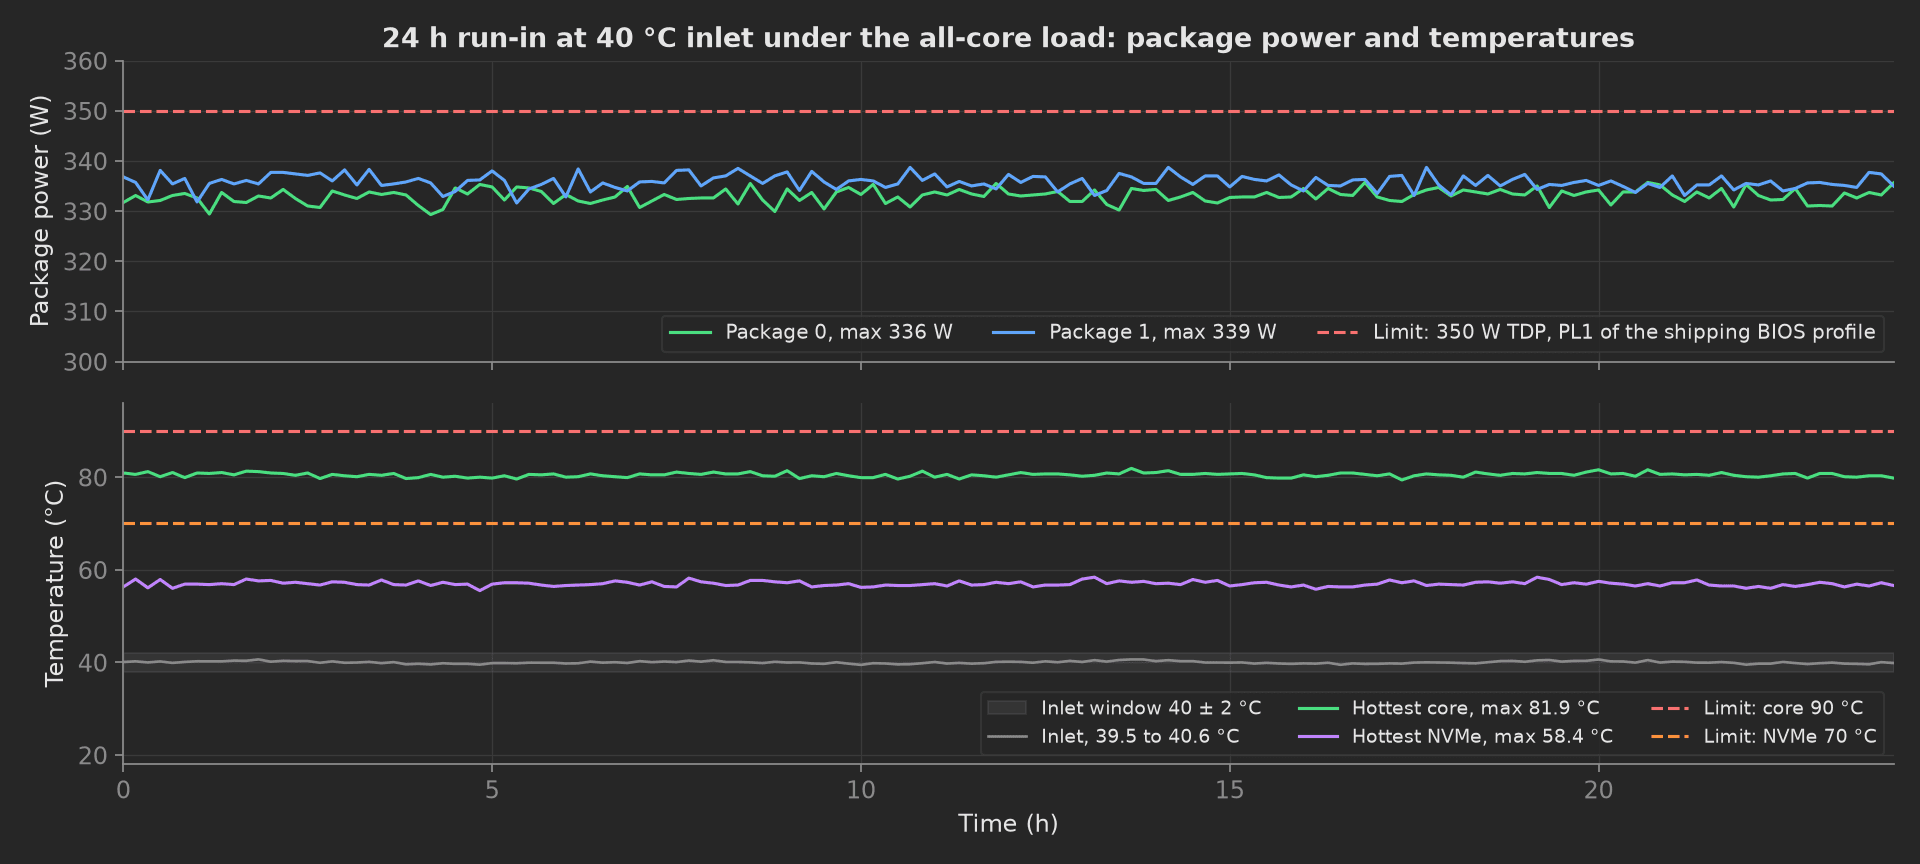
The mock server's run-in: both packages at 333 to 339 W under the 350 W TDP the shipping BIOS profile sets as PL1, the hottest core at 81 °C with the inlet at 40 °C, the hottest drive at 58 °C, and nothing added to any counter over the 24 hours.
The framework mechanics on show are previous-results injection, with run_in receiving the memory_test and nvme_test results as parameters and computing its deltas from them; an executable phase for the fio preconditioning, judged on its exit code and chained with depends_on and a timeout like any Python phase; JSON == on whole objects for the firmware set, the processors, the link state and the boot configuration; attach.file for the Redfish inventory; a timeout sized per phase up to the framework's 24 h cap; and per-device multi-dimensional measurements judged on min and max aggregations.
Equipment & Setup
To run this L10 test on an integration line, the following are required:
- A network path to the server's BMC with Redfish enabled, and to the test OS image over the data network
- A PXE-booted test OS image carrying the memory tester,
edac-util, STREAM,fio,nvme-cli, a loopback traffic generator and the stress load - Two 100 GbE loopback plugs (QSFP28, 0 dB) for the NIC ports
- A thermal chamber or a hot aisle holding 40 °C inlet for the run-in, with the server on the line's power feed through both PSUs
- The Device Under Test (DUT): a 2U dual-socket x86 server with 2 CPUs, 32 DIMMs, 8 NVMe drives, 2 x 100 GbE adapters, the release BIOS, BMC and CPLD, and the test BIOS profile that exposes the counters
- A TofuPilot Framework procedure to sequence the phases and validate the limits
- The TofuPilot Dashboard to keep the per-server evidence and the first-pass yield per line
Hardware Components
BMC and Test OS Image
The BMC is the only instrument this station owns. Over DMTF Redfish it answers the firmware inventory (/redfish/v1/UpdateService/FirmwareInventory), the memory, storage and network collections under /Systems/1, the system event log under /Managers/1/LogServices/SEL, the BIOS settings and the thermal and power sensors that the stress and run-in phases sample. Everything else runs in the test OS: lspci -vv for the negotiated PCIe links, the memory tester and edac-util for the ECC counters, STREAM for the bandwidth, fio with --output-format=json for the preconditioning and the steady-state rounds, nvme-cli for smart-log and the OCP ocp smart-add-log, and stress-ng for the all-core load. The image is PXE-booted so the drives stay blank; the customer's OS is installed at L11 or on site.
A single-server station: the unit on the bench with its cover off for the L10 witness, the management port to the station's switch, the loopback plugs on the two QSFP28 cages, and the production computer running the procedure. The run-in moves the closed unit to the chamber; the same plug follows it because both sessions go over the network.
Loopback Plugs, Chamber and Traffic
A 100 GbE loopback plug returns every frame the port sends to the same port through the four lanes of the cage, so a frame lost in 60 s at line rate is a lane, a retimer or a cage that will drop frames in the customer's rack. The generator can be the NIC vendor's own loopback tool or Cisco TRex on the test image. The run-in needs 40 °C at the inlet with the server under load; a reach-in chamber from Thermotron or Weiss Technik holds it to ±2 °C, and a hot-aisle enclosure with a heater does the same for a row of units at once. The chamber's setpoint and the soak duration are written into the run's metadata so a unit tested at a different profile can be found later.
Where the Limits Come From
| Test | Limit | Basis |
|---|---|---|
| Firmware, processors, counts, speed | exact match with the golden configuration | the release; no tolerance applies |
| PCIe links | Gen5 x16 on every NIC, Gen5 x4 on every NVMe, AER correctable = 0 | the board's block diagram; a link that trained lower is a seating or a signal-integrity fault |
| MemTest86, ECC | 0 bit errors, 0 correctable, 0 uncorrectable | this line's: a DIMM that corrects at L10 will correct more in the rack |
| STREAM triad | peak ≥ 400 GB/s | this line's derivation: 65 % of the 614 GB/s theoretical of 16 channels at 4800 MT/s; a channel that trained slow or in a degraded mode drops the triad below it |
| fio at steady state | min ≥ 2.0 M IOPS (4 KiB random read), min ≥ 11.2 GB/s (128 KiB sequential read) | this line's: 80 % of the drive's datasheet; SNIA PTS-E defines how to measure, not a pass mark |
| SMART | media errors = 0, percentage used ≤ 1 %, PLP capacitor health ≥ 100 % | OCP Datacenter NVMe SSD v2.6 for the fields (SMART 02h, extended SMART C0h); the values are this line's for a new drive |
| NIC loopback | frames lost = 0, FCS errors = 0, ≥ 480 M frames in 60 s, 100000 Mb/s full duplex RS-FEC on both ports | this line's: line rate at 1518 B frames is 8.1 M frames/s; the link state is the release |
| CPU stress | max ≤ 350 W per socket, settled mean ≥ 300 W, hottest core ≤ 85 °C, fan duty ≤ 80 % at the end, throttle events = 0 | the TDP is the CPU's and PL1 of the shipping profile; 85 % of TDP, 85 °C at 25 °C inlet and the fan headroom are this line's |
| Run-in | 24 h at 40 ± 2 °C, max ≤ 350 W, hottest core ≤ 90 °C, hottest NVMe ≤ 70 °C, every delta = 0 | integrator practice for the duration and ambient (24 to 72 h, no normative number); 90 °C is 10 °C under PROCHOT, 70 °C is 10 °C under the drive's warning threshold, this line's |
| BIOS checksum, boot config, SEL | exact match, 0 entries | the shipping profile of the release |
Two rows in that table are traps. The STREAM floor is not the datasheet's bandwidth: a triad reaches 70 to 75 % of the theoretical on a healthy platform, so a floor set at the theoretical fails every unit and a floor set at 50 % passes a server with one channel down. And the ECC rule is zero at L10 because the counter is the only early signal a DIMM gives; a line that allows a few correctable errors here has no baseline to compare the run-in delta against, which is why run_in receives the per-DIMM counts from memory_test rather than a total.
Test Procedure
Overview
The procedure maps the L10 test onto the framework's three stages. The inventory and the PCIe links live in setup: so a unit with the wrong firmware or a drive on a x2 link never enters the two hours of memory and drive testing; pcie_links depends on bmc_and_inventory because both use the same server sessions. The main phases are chained in order on the one server. The SEL clear, the shipping BIOS profile and the inventory attachment live in teardown: so a unit pulled for repair after a failed run-in still leaves with the test profile removed.
- Setup: BMC reachable, firmware and processors against the golden configuration, counts, SEL cleared.
- Setup: PCIe generation and width per NIC and NVMe, AER count.
- Main: MemTest86 patterns, ECC per DIMM, STREAM triad.
- Main: fio preconditioning as an executable phase.
- Main: fio at steady state and SMART per drive.
- Main: 100 GbE loopback on both ports.
- Main: all-core stress against the TDP, hottest core, fan duty.
- Main: 24 h run-in at 40 °C, deltas against phases 3 and 5.
- Teardown: SEL cleared, shipping BIOS profile, metadata, inventory attached.
Every metric validates against limits declared in procedure.yaml, and results stream to TofuPilot as the per-server evidence.
Why TofuPilot Framework?
TofuPilot Framework is a YAML + Python test framework built for hardware manufacturing. Instead of writing all your test logic, measurements, and limits inside Python code, you describe what the test does in a procedure.yaml file, and how in small Python phase files. The framework handles:
- Automatic Python environment management (via
uv) - Operator UI (no frontend code needed)
- Measurement validation and live charts
- Process isolation between phases and equipment plugs
Project Structure
You can find the full source on GitHub. The ServerUnderTest plug is a mock of the BMC's Redfish session and the test OS's SSH session together, synthesizing a healthy build with every firmware at the golden version, every link at full generation and width, zero errors on every counter and 335 W per socket under the 350 W TDP, so the procedure runs end-to-end without a server connected. The nvme_precondition phase runs scripts/fio_precondition.py, which prints the JSON fio prints and exits 0, in place of the real fio --output-format=json.
tofupilot run .For CI or bench automation, the same run executes headless:
tofupilot run . --no-tui --no-kiosk --jsonThe Procedure File
procedure.yaml declares the unit, the server plug with the BMC address and the label serial as constructor arguments, and the three stages with every measurement and limit:
procedure.yaml462 lines
name: Server L10 System Test and Run-Inversion: 0.1.0description: L10 system test of a 2U dual-socket x86 server after L6 to L9 assembly. BMC inventory and firmware against the golden configuration over Redfish, PCIe link gen and width of every NIC and NVMe, MemTest86 patterns with per-DIMM ECC and a STREAM triad, fio preconditioning as an executable phase then steady-state IOPS and MB/s with SMART per drive, 100 GbE loopback on both ports, an all-core stress against the TDP, a 24 h run-in at 40 C whose counters are compared with the earlier phases, and a teardown that ships the BIOS profile and attaches the Redfish inventory.unit: auto_identify: true serial_number: description: "Scan the service tag on the front bezel" placeholder: "2U-DS-000000" pattern: "^2U-DS-\\d{6}$" default_value: "2U-DS-004217" part_number: default_value: "SRV-2U-DS-G5" batch_number: default_value: "LOT-2026-39"plugs: - name: Server Under Test description: "The BMC over Redfish and the test OS over SSH (mock, one plug per server)" python: plugs.server:ServerUnderTest key: server config: bmc_host: "10.20.30.41" serial_number: "2U-DS-004217"setup: - name: BMC and Inventory key: bmc_and_inventory python: phases.bmc_and_inventory measurements: - name: BMC Reachable key: bmc_reachable description: "Redfish session opened on the BMC's management port." validators: - {operator: "==", expected_value: true} - name: Firmware Versions key: firmware_versions description: "BIOS, BMC and CPLD from the Redfish firmware inventory as one object against the golden configuration." validators: - operator: "==" expected_value: bios: 2.4.1 bmc: 1.12.0 cpld: "0x1a" - name: Processors key: processors validators: - operator: "==" expected_value: count: 2 model: x86-64 64C/128T 350W - name: DIMM Count key: dimm_count validators: - {operator: "==", expected_value: 32} - name: Memory Total key: memory_total_gb unit: GB validators: - {operator: "==", expected_value: 2048} - name: DIMM Minimum Speed key: dimm_min_speed_mt_s unit: MT/s description: "The slowest configured DIMM speed. One DIMM from a slower reel drags the whole channel down to its speed." validators: - {operator: "==", expected_value: 4800} - name: NVMe Count key: nvme_count validators: - {operator: "==", expected_value: 8} - name: NIC Count key: nic_count validators: - {operator: "==", expected_value: 2} - name: SEL Entries After Clear key: sel_entries_after_clear description: "The system event log is cleared so the run-in starts from zero." validators: - {operator: "==", expected_value: 0} - name: PCIe Links key: pcie_links python: phases.pcie_links depends_on: [bmc_and_inventory] measurements: - name: NIC PCIe Links key: pcie_nic_links title: Negotiated PCIe link per NIC x_axis: legend: Device y_axis: - legend: Generation key: gen aggregations: - type: min_gen validators: - {operator: "==", expected_value: 5} - legend: Width key: width unit: lanes aggregations: - type: min_width validators: - {operator: "==", expected_value: 16} - name: NVMe PCIe Links key: pcie_nvme_links title: Negotiated PCIe link per NVMe drive x_axis: legend: Device y_axis: - legend: Generation key: gen aggregations: - type: min_gen validators: - {operator: "==", expected_value: 5} - legend: Width key: width unit: lanes aggregations: - type: min_width validators: - {operator: "==", expected_value: 4} - name: AER Correctable Errors key: aer_correctable_errors description: "PCIe Advanced Error Reporting correctable count since boot, all devices." validators: - {operator: "==", expected_value: 0}main: - name: Memory Test key: memory_test python: phases.memory_test timeout: 3h measurements: - name: MemTest Bit Errors key: memtest_bit_errors description: "Seven MemTest86 patterns, two passes each, over all 2 TB." validators: - {operator: "==", expected_value: 0} - name: ECC Per DIMM key: ecc_per_dimm title: ECC counters per DIMM after the pattern test x_axis: legend: DIMM y_axis: - legend: Correctable key: correctable aggregations: - type: max validators: - {operator: "==", expected_value: 0} - legend: Uncorrectable key: uncorrectable aggregations: - type: max validators: - {operator: "==", expected_value: 0} - name: Correctable ECC Total key: correctable_ecc_total validators: - {operator: "==", expected_value: 0} - name: STREAM Bandwidth key: stream_bandwidth title: STREAM triad against thread count x_axis: legend: Threads y_axis: - legend: Triad key: triad unit: GB/s aggregations: - type: peak_gb_s unit: GB/s validators: - {operator: ">=", expected_value: 400.0} - name: NVMe Precondition key: nvme_precondition depends_on: [memory_test] timeout: 2h executable: command: "python3 scripts/fio_precondition.py --drives 8 --capacity-tb 7.68 --loops 2 --output-format=json" - name: NVMe Test key: nvme_test python: phases.nvme_test depends_on: [nvme_precondition] timeout: 1h measurements: - name: NVMe Performance key: nvme_performance title: Steady-state fio per drive after PTS-E preconditioning x_axis: legend: Drive y_axis: - legend: 4 KiB random read key: rand_read_4k_iops unit: IOPS aggregations: - type: min unit: IOPS validators: - {operator: ">=", expected_value: 2000000} - legend: 128 KiB sequential read key: seq_read_128k_mb_s unit: MB/s aggregations: - type: min unit: MB/s validators: - {operator: ">=", expected_value: 11200} - name: NVMe SMART key: nvme_smart title: SMART 02h and OCP extended SMART C0h per drive x_axis: legend: Drive y_axis: - legend: Media errors key: media_errors aggregations: - type: max validators: - {operator: "==", expected_value: 0} - legend: Percentage used key: percentage_used unit: "%" aggregations: - type: max unit: "%" validators: - {operator: "<=", expected_value: 1} - legend: PLP capacitor health key: capacitor_health_pct unit: "%" aggregations: - type: min unit: "%" validators: - {operator: ">=", expected_value: 100} - name: Media Errors Total key: media_errors_total validators: - {operator: "==", expected_value: 0} - name: NIC Loopback key: nic_loopback python: phases.nic_loopback depends_on: [nvme_test] measurements: - name: NIC Loopback key: nic_loopback title: Line-rate loopback per port for 60 s x_axis: legend: Port y_axis: - legend: Frames sent key: frames_sent aggregations: - type: min validators: - {operator: ">=", expected_value: 480000000} - legend: Frames lost key: frames_lost aggregations: - type: max validators: - {operator: "==", expected_value: 0} - legend: FCS errors key: fcs_errors aggregations: - type: max validators: - {operator: "==", expected_value: 0} - name: NIC Link State key: nic_link_state description: "Speed, duplex and FEC mode of both ports as ethtool reports them, as one object." validators: - operator: "==" expected_value: port1: {speed_mb_s: 100000, duplex: full, fec: rs} port2: {speed_mb_s: 100000, duplex: full, fec: rs} - name: CPU Stress and Power key: cpu_stress_and_power python: phases.cpu_stress_and_power depends_on: [nic_loopback] timeout: 20m measurements: - name: CPU Stress key: cpu_stress title: All cores at 100 percent for 10 min at 25 C inlet x_axis: legend: Time unit: s y_axis: - legend: Package 0 power key: package_0_w unit: W aggregations: - type: max_w unit: W validators: - {operator: "<=", expected_value: 350.0} - type: settled_mean_w unit: W validators: - {operator: ">=", expected_value: 300.0} - legend: Package 1 power key: package_1_w unit: W aggregations: - type: max_w unit: W validators: - {operator: "<=", expected_value: 350.0} - type: settled_mean_w unit: W validators: - {operator: ">=", expected_value: 300.0} - legend: Hottest core key: hottest_core_c unit: °C aggregations: - type: max_c unit: °C validators: - {operator: "<=", expected_value: 85.0} - legend: Fan duty key: fan_duty_pct unit: "%" aggregations: - type: end_pct unit: "%" validators: - {operator: "<=", expected_value: 80.0} - name: Throttle Events key: throttle_events description: "PROCHOT and power-limit throttle counters over the stress, both sockets." validators: - {operator: "==", expected_value: 0} - name: Run-In key: run_in python: phases.run_in depends_on: [cpu_stress_and_power] timeout: 24h measurements: - name: Run-In Trace key: run_in_trace title: 24 h run-in at 40 C inlet under the all-core load x_axis: legend: Time unit: h y_axis: - legend: Inlet key: inlet_c unit: °C aggregations: - type: min_c unit: °C validators: - {operator: ">=", expected_value: 38.0} - type: max_c unit: °C validators: - {operator: "<=", expected_value: 42.0} - legend: Package 0 power key: package_0_w unit: W aggregations: - type: max_w unit: W validators: - {operator: "<=", expected_value: 350.0} - legend: Package 1 power key: package_1_w unit: W aggregations: - type: max_w unit: W validators: - {operator: "<=", expected_value: 350.0} - legend: Hottest core key: hottest_core_c unit: °C aggregations: - type: max_c unit: °C validators: - {operator: "<=", expected_value: 90.0} - legend: Hottest NVMe key: hottest_nvme_c unit: °C aggregations: - type: max_c unit: °C validators: - {operator: "<=", expected_value: 70.0} - name: ECC Delta Per DIMM key: ecc_delta_per_dimm title: Correctable ECC added per DIMM over the run-in x_axis: legend: DIMM y_axis: - legend: Correctable added key: correctable_delta aggregations: - type: max validators: - {operator: "==", expected_value: 0} - name: Media Error Delta Per Drive key: media_error_delta_per_drive title: NVMe media errors added per drive over the run-in x_axis: legend: Drive y_axis: - legend: Media errors added key: media_error_delta aggregations: - type: max validators: - {operator: "==", expected_value: 0} - name: SEL Entries Added key: sel_entries_added description: "System event log entries written during the run-in. The log was cleared at setup, so every entry is the run-in's." validators: - {operator: "==", expected_value: 0} - name: Throttle Events key: throttle_events validators: - {operator: "==", expected_value: 0} - name: PSU Redundancy Events key: psu_redundancy_events description: "Redundancy-lost events from either PSU over the run-in." validators: - {operator: "==", expected_value: 0}teardown: - name: Clear and Ship Config key: clear_and_ship_config python: phases.clear_and_ship_config measurements: - name: SEL Entries After Clear key: sel_entries_after_clear description: "Ships empty, so the first entry the customer reads was written in their rack." validators: - {operator: "==", expected_value: 0} - name: BIOS Checksum key: bios_checksum description: "Checksum of the BIOS settings after the shipping profile is applied, against the release." validators: - {operator: "==", expected_value: "sha256:7c3e19b0"} - name: Boot Config key: boot_config description: "Boot order, RAID mode and Secure Boot as one object against the shipping configuration." validators: - operator: "==" expected_value: boot_order: [Pxe, Hdd] raid: none secure_boot: trueFramework features to notice:
- Previous results as parameters.
run_in(measurements, server, run, memory_test, nvme_test, log)names two earlier phases in its signature and receives their results:memory_test.measurements.ecc_per_dimm.y_axis.correctableandnvme_test.measurements.nvme_smart.y_axis.media_errorsare the baselines its deltas are computed from.depends_onguarantees they have completed. - An executable phase in the chain.
nvme_preconditionhas no Python: it runs a command, passes on exit code 0, and carriesdepends_on,timeout: 2hand a place in the sequence like every other phase.nvme_testwaits for it. - A whole object, compared once.
firmware_versions,processors,nic_link_stateandboot_configeach validate with one==; the report shows which key differed. attach.filefor the as-shipped record. The teardown writes the Redfish inventory to a file and attaches it under the unit's serial, next to the MAC addresses and part serials it writes intounit.metadata.timeoutsized per phase. 3 h for the memory patterns, 2 h for the preconditioning, 1 h for the drives, 20 min for the stress, and24hon the run-in, which is the framework's cap.- Per-device multi-dimensional measurements.
pcie_nic_links,pcie_nvme_links,ecc_per_dimm,nvme_performance,nvme_smartandnic_loopbackcarry one point per device and are judged on the worst one through aminormaxaggregation, so the report names the drive or the DIMM. run.metadatafor the soak profile. The run-in's hours and ambient are written on the run, so units soaked at a different profile can be filtered apart on the dashboard.
BMC and Inventory
The first Redfish transaction, and the highest-yield step in the sequence. The firmware set and the processor description are recorded as objects and compared with the golden configuration in one validator each; the DIMMs, drives and adapters are counted and the slowest DIMM speed is recorded, because one DIMM from a slower reel drags its whole channel down to its speed without any other symptom. The SEL is cleared so every entry the run-in finds is the run-in's.
phases/bmc_and_inventory.py33 lines
from utils.recipe import DIMM_CAPACITY_GB, DIMM_COUNTdef bmc_and_inventory(measurements, server, unit, log): """Setup: the BMC answers over Redfish, the firmware set is the golden one as a single object, and the populated parts are counted. A unit that carries one DIMM from the wrong reel or a BIOS one build behind the release fails here, before any test that would take an hour to say the same thing. The SEL is cleared so the run-in starts empty.""" reachable = server.redfish_reachable() firmware = server.redfish_firmware() cpus = server.redfish_processors() dimms = server.redfish_memory() drives = server.redfish_storage() nics = server.redfish_network() server.redfish_sel_clear() sel = server.redfish_sel_count() total_gb = sum(d["capacity_gb"] for d in dimms) min_speed = min(d["speed_mt_s"] for d in dimms) measurements.bmc_reachable = reachable measurements.firmware_versions = firmware measurements.processors = cpus measurements.dimm_count = len(dimms) measurements.memory_total_gb = total_gb measurements.dimm_min_speed_mt_s = min_speed measurements.nvme_count = len(drives) measurements.nic_count = len(nics) measurements.sel_entries_after_clear = sel unit.metadata["bios"] = firmware["bios"] unit.metadata["bmc_fw"] = firmware["bmc"] log.info(f"{unit.serial_number}: BIOS {firmware['bios']}, BMC {firmware['bmc']}, CPLD {firmware['cpld']}; {cpus['count']}x {cpus['model']}") log.info(f"{len(dimms)}/{DIMM_COUNT} DIMMs, {total_gb} GB at {min_speed} MT/s min (expected {DIMM_COUNT}x{DIMM_CAPACITY_GB} GB); {len(drives)} NVMe, {len(nics)} NICs; SEL cleared, {sel} entries")PCIe Links
The negotiated link of every NIC and NVMe from the OS after boot. A drive seated at an angle in its bay trains at x2 and passes every functional test at half its bandwidth; a NIC that trained at Gen4 on a Gen5 slot passes the loopback and delivers half its throughput. Both are found only by reading the link, which is why this phase gates the main stage. The AER correctable count is a separate scalar: a retimer that corrects its way through training is a return in six months.
phases/pcie_links.py26 lines
def pcie_links(measurements, server, log): """Setup: the negotiated PCIe link of every NIC and every NVMe from the OS. A drive seated at an angle trains at x2 and passes every functional test at half its bandwidth; only the link width says so. AER correctable errors after boot must be zero: a retimer or a connector that corrects its way through is a field return.""" nics, nvme = server.os_pcie_links() aer = server.os_aer_correctable_errors() m = measurements.pcie_nic_links m.x_axis = [d["device"] for d in nics] m.y_axis.gen = [d["gen"] for d in nics] m.y_axis.gen.aggregations.min_gen = min(d["gen"] for d in nics) m.y_axis.width = [d["width"] for d in nics] m.y_axis.width.aggregations.min_width = min(d["width"] for d in nics) m = measurements.pcie_nvme_links m.x_axis = [d["device"] for d in nvme] m.y_axis.gen = [d["gen"] for d in nvme] m.y_axis.gen.aggregations.min_gen = min(d["gen"] for d in nvme) m.y_axis.width = [d["width"] for d in nvme] m.y_axis.width.aggregations.min_width = min(d["width"] for d in nvme) measurements.aer_correctable_errors = aer links = ", ".join(f"{d['device']} Gen{d['gen']} x{d['width']}" for d in nics + nvme) log.info(f"Links after training: {links}; AER correctable {aer}")Memory Test
Seven MemTest86 patterns, two passes each, over all 2 TB, then the ECC counters read per DIMM and a STREAM triad at 16 to 128 threads. The bit-error count and the uncorrectable count are zero or the unit stops; the correctable count is recorded per DIMM so the run-in can compute a delta per slot. The triad rises with the thread count until every channel has requests in flight and saturates at the platform's real bandwidth; a channel that trained slow moves the plateau down, and the floor catches it. Two passes of seven patterns take about 90 minutes on the line; the mock is time-scaled and the timeout is sized for the real one.
phases/memory_test.py32 lines
from utils.recipe import MEMTEST_PASSES, MEMTEST_PATTERNS, STREAM_ARRAY_GB, STREAM_THREADSdef memory_test(measurements, server, log): """The MemTest86 pattern set over all 2 TB, then the ECC counters per DIMM and a STREAM triad at rising thread counts. Bit errors and uncorrectable ECC are zero or the unit stops; correctable ECC is recorded per DIMM so a slot that starts correcting during the run-in can be named. The triad floor catches a channel that trained slow. Two passes of seven patterns take about 90 min on the line; the mock is time-scaled.""" errors = 0 for pattern in MEMTEST_PATTERNS: e = server.os_memtest(pattern, MEMTEST_PASSES) errors += e log.info(f"{pattern} x{MEMTEST_PASSES}: {e} errors (mock: instant)") correctable, uncorrectable = server.os_ecc_counters() triad = [server.os_stream_triad(n) for n in STREAM_THREADS] measurements.memtest_bit_errors = errors m = measurements.ecc_per_dimm m.x_axis = list(range(1, len(correctable) + 1)) m.y_axis.correctable = correctable m.y_axis.correctable.aggregations.max = max(correctable) m.y_axis.uncorrectable = uncorrectable m.y_axis.uncorrectable.aggregations.max = max(uncorrectable) measurements.correctable_ecc_total = sum(correctable) s = measurements.stream_bandwidth s.x_axis = STREAM_THREADS s.y_axis.triad = triad s.y_axis.triad.aggregations.peak_gb_s = max(triad) log.info(f"ECC: {sum(correctable)} correctable, {sum(uncorrectable)} uncorrectable over {len(correctable)} DIMMs; STREAM triad on {STREAM_ARRAY_GB:.0f} GB arrays peaks at {max(triad):.0f} GB/s with {STREAM_THREADS[triad.index(max(triad))]} threads")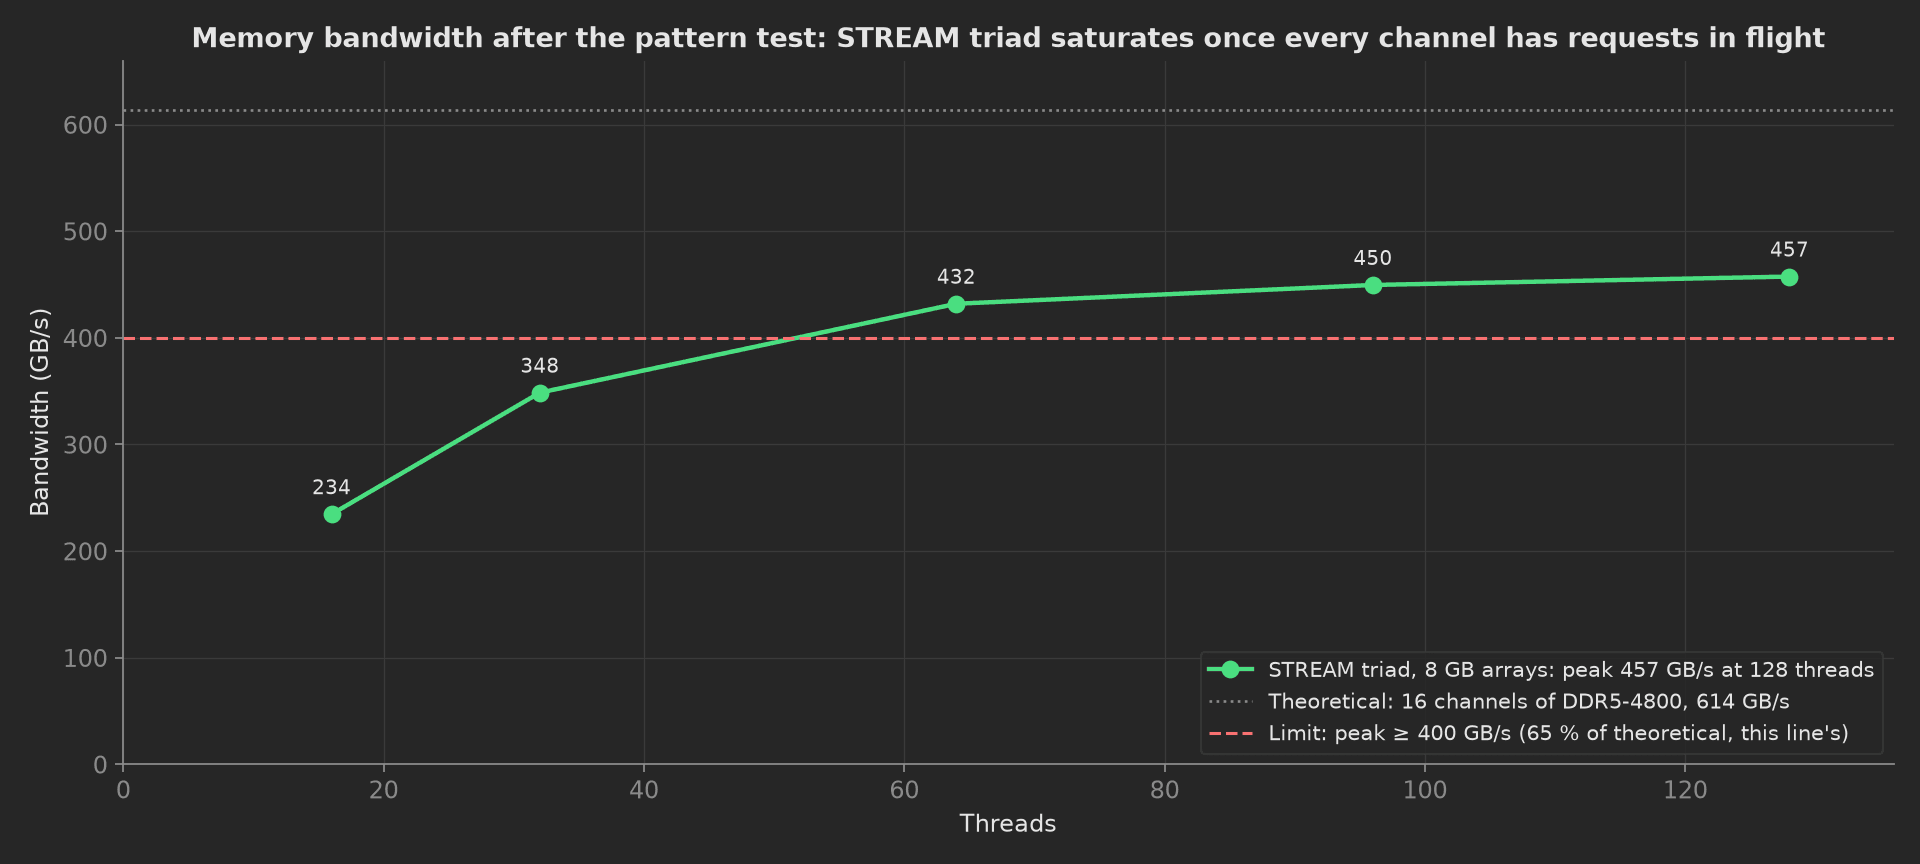
The mock's triad: 234 GB/s at 16 threads, 432 GB/s at 64, a plateau at 457 GB/s from 96 threads on, 74 % of the theoretical 614 GB/s. A server with one channel in a degraded mode plateaus near 400 GB/s and fails on the peak.
NVMe Precondition
An executable phase, not a Python one. SNIA PTS-E requires a purge and then twice the drive's capacity written in 128 KiB sequential blocks before any steady-state number means anything, and that is a fio command line, not a measurement. The phase runs the command, passes on exit code 0, and fails on anything else: a drive that fails to open or reports a write error makes fio exit non-zero. On the line the command is fio --name=precondition --filename=/dev/nvme1n1:... --rw=write --bs=128k --loops=2 --output-format=json, about 45 minutes for eight 7.68 TB drives in parallel; the template runs a stand-in that prints the same JSON shape:
scripts/fio_precondition.py45 lines
"""Stand-in for the SNIA PTS-E preconditioning command, run by theexecutable phase `nvme_precondition`: fio --name=precondition --filename=/dev/nvme1n1:/dev/nvme2n1:... \ --rw=write --bs=128k --ioengine=io_uring --iodepth=32 --direct=1 \ --loops=2 --output-format=jsonThe real command writes twice the capacity of every drive in 128 KiBsequential blocks after a purge, about 45 minutes for eight 7.68 TBdrives in parallel. This script prints the same JSON shape fio printsand exits 0; a drive that fails to open or reports a write error makesfio exit non-zero, which fails the phase."""import argparseimport jsonimport sysdef main(): parser = argparse.ArgumentParser() parser.add_argument("--drives", type=int, default=8) parser.add_argument("--capacity-tb", type=float, default=7.68) parser.add_argument("--loops", type=int, default=2) parser.add_argument("--output-format", default="json") args = parser.parse_args() written_bytes = int(args.capacity_tb * 1e12 * args.loops) bw_kib_s = 6_400_000 # 6.4 GB/s of 128 KiB sequential writes per drive runtime_ms = int(written_bytes / (bw_kib_s * 1024) * 1000) jobs = [ { "jobname": f"precondition-nvme{i + 1}", "error": 0, "write": {"io_bytes": written_bytes, "bw": bw_kib_s, "iops": bw_kib_s / 128, "runtime": runtime_ms}, } for i in range(args.drives) ] report = {"fio version": "fio-3.37 (mock)", "global options": {"rw": "write", "bs": "128k", "loops": str(args.loops)}, "jobs": jobs} json.dump(report, sys.stdout, indent=2) print() sys.exit(0 if all(j["error"] == 0 for j in jobs) else 1)if __name__ == "__main__": main()NVMe Test
Every drive at steady state: five 60 s rounds of 4 KiB random read and of 128 KiB sequential read, the mean of the rounds recorded per drive and the slowest drive judged against 80 % of the datasheet. Then SMART per drive: media errors, percentage used and the PLP capacitor health from the OCP extended log, each judged on the worst drive. A drive that reports 3 % used at L10 has a history the customer did not buy; a capacitor health under 100 % on a new drive is a power-loss-protection bank that will not hold the write cache through a PSU event.
phases/nvme_test.py40 lines
from utils.recipe import NVME_COUNT, NVME_ROUND_S, NVME_STEADY_STATE_ROUNDSdef nvme_test(measurements, server, log): """After the executable preconditioning, every drive at steady state: 4 KiB random read IOPS and 128 KiB sequential read MB/s as the mean of the PTS-E rounds, judged on the slowest drive against 80 % of the datasheet. Then SMART: media errors, percentage used and the PLP capacitor health from the OCP extended log, per drive. Five 60 s rounds on eight drives are 40 min on the line; the mock is time-scaled.""" drives = list(range(1, NVME_COUNT + 1)) iops, mb_s, media, used, cap, temp = [], [], [], [], [], [] for d in drives: i, m = server.os_fio_steady_state(d, NVME_STEADY_STATE_ROUNDS, NVME_ROUND_S) smart = server.os_nvme_smart(d) iops.append(i) mb_s.append(m) media.append(smart["media_errors"]) used.append(smart["percentage_used"]) cap.append(smart["capacitor_health_pct"]) temp.append(smart["temperature_c"]) log.info(f"nvme{d}: {i / 1e6:.2f} M IOPS, {m:.0f} MB/s; SMART media errors {smart['media_errors']}, used {smart['percentage_used']} %, capacitor {smart['capacitor_health_pct']} %, {smart['temperature_c']:.0f} C") p = measurements.nvme_performance p.x_axis = drives p.y_axis.rand_read_4k_iops = iops p.y_axis.rand_read_4k_iops.aggregations.min = min(iops) p.y_axis.seq_read_128k_mb_s = mb_s p.y_axis.seq_read_128k_mb_s.aggregations.min = min(mb_s) s = measurements.nvme_smart s.x_axis = drives s.y_axis.media_errors = media s.y_axis.media_errors.aggregations.max = max(media) s.y_axis.percentage_used = used s.y_axis.percentage_used.aggregations.max = max(used) s.y_axis.capacitor_health_pct = cap s.y_axis.capacitor_health_pct.aggregations.min = min(cap) measurements.media_errors_total = sum(media) log.info(f"Slowest drive: {min(iops) / 1e6:.2f} M IOPS, {min(mb_s):.0f} MB/s; {sum(media)} media errors over {NVME_COUNT} drives")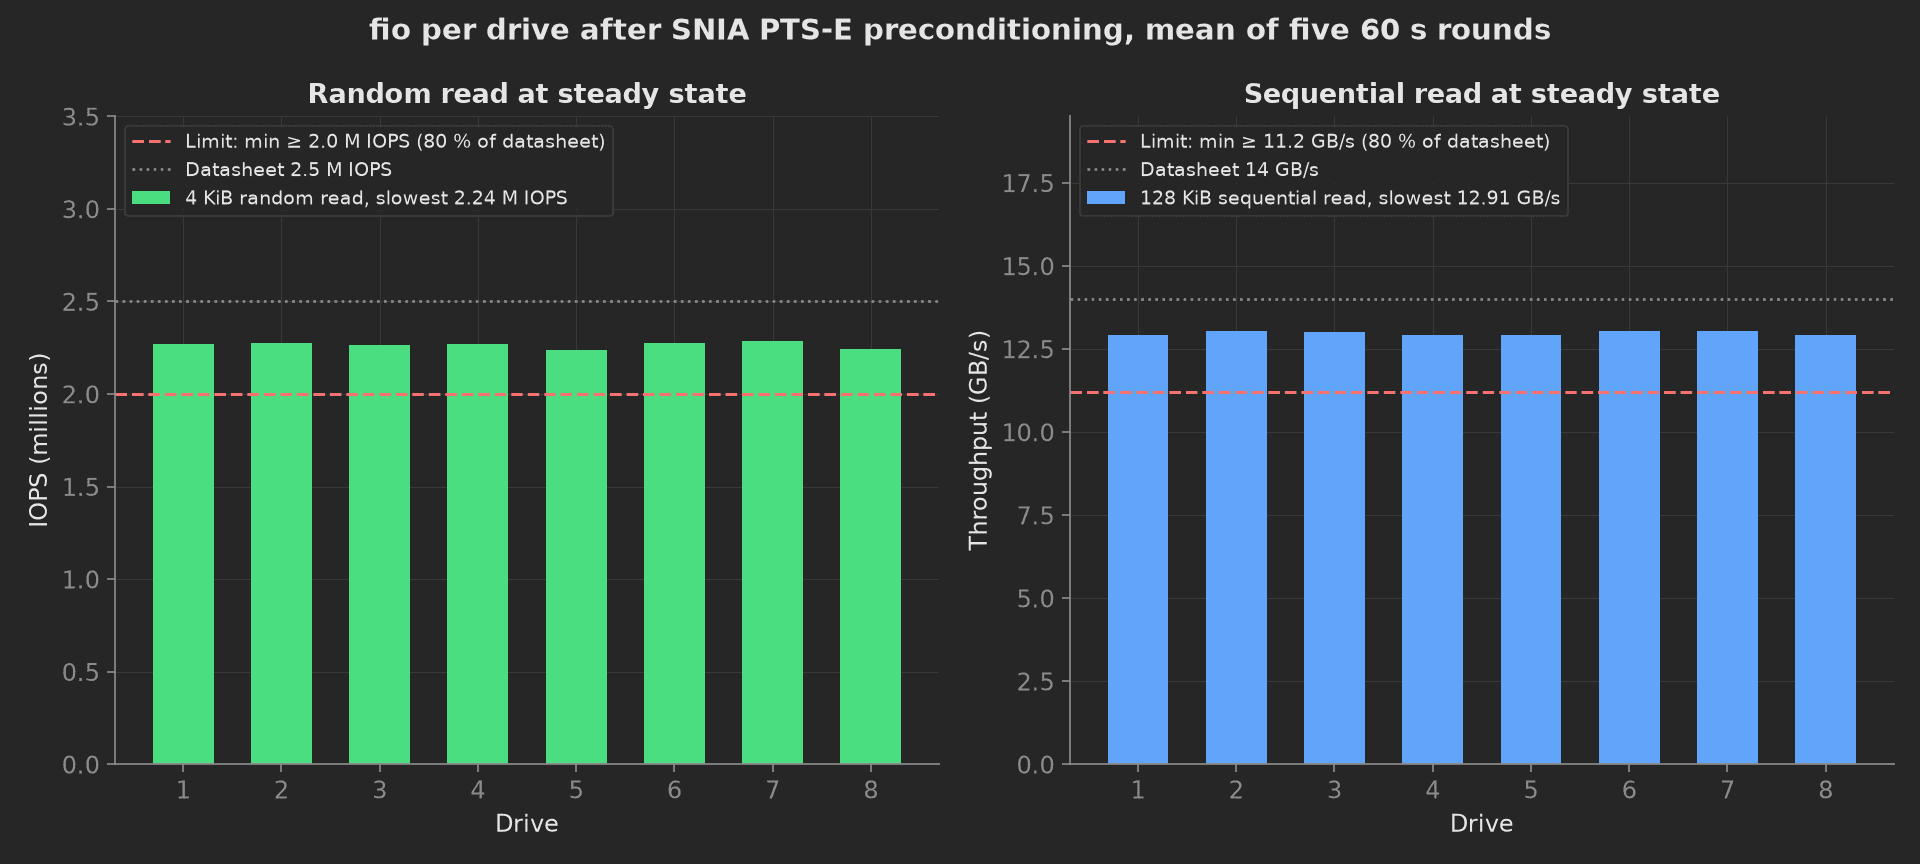
The mock's eight drives at steady state: 2.24 to 2.29 M IOPS and 12.9 to 13.1 GB/s, all within 3 % of each other, over floors at 2.0 M IOPS and 11.2 GB/s. A drive on a x2 link shows up in this chart at half the sequential number, which is why the link is checked first: the two faults are told apart by which phase failed.
NIC Loopback
Both QSFP28 ports with a loopback plug, line-rate frames for 60 s. Every frame must return, the FCS counter must stay at zero, and the link must have negotiated 100 GbE full duplex with RS-FEC, recorded as one object for both ports. A port that linked at 40G because one lane of the cage is dirty, or drops one frame in ten million from a marginal retimer, is found here and not in the customer's rack. The frame count is a multi-dimensional measurement per port with a floor, so a run that ended early is also caught.
phases/nic_loopback.py28 lines
from utils.recipe import NIC_COUNT, NIC_LOOPBACK_Sdef nic_loopback(measurements, server, log): """Both QSFP28 ports with a fibre loopback plug: line-rate frames for 60 s, every frame must come back, and the link must have negotiated 100 GbE full duplex with RS-FEC. A port that links at 40G because one lane of the cage is dirty, or drops one frame in ten million from a marginal retimer, is found here and not in the customer's rack.""" ports = list(range(1, NIC_COUNT + 1)) sent, lost, fcs, link = [], [], [], {} for p in ports: r = server.os_nic_loopback(p, NIC_LOOPBACK_S) sent.append(r["frames_sent"]) lost.append(r["frames_lost"]) fcs.append(r["fcs_errors"]) link[f"port{p}"] = {"speed_mb_s": r["speed_mb_s"], "duplex": r["duplex"], "fec": r["fec"]} log.info(f"port{p}: {r['frames_sent']:,} frames in {NIC_LOOPBACK_S} s, {r['frames_lost']} lost, {r['fcs_errors']} FCS errors, {r['speed_mb_s'] // 1000} GbE {r['duplex']} {r['fec']} (mock: instant)") m = measurements.nic_loopback m.x_axis = ports m.y_axis.frames_sent = sent m.y_axis.frames_sent.aggregations.min = min(sent) m.y_axis.frames_lost = lost m.y_axis.frames_lost.aggregations.max = max(lost) m.y_axis.fcs_errors = fcs m.y_axis.fcs_errors.aggregations.max = max(fcs) measurements.nic_link_state = linkCPU Stress and Power
All cores at 100 % for 10 minutes at the room's 25 °C, sampled from the BMC every 5 s. Each socket's package power must reach the power limit in the second half of the run and not exceed the TDP the shipping profile sets as PL1; the hottest core must stay under 85 °C; the fan controller must end with headroom; and the throttle counters must stay at zero. A heatsink with a missing thermal pad shows as one socket hot and its package power capped under the other's; a socket that never reaches 300 W exercised fewer cores than it should, or has a power cap the profile did not set.
phases/cpu_stress_and_power.py31 lines
import numpy as npfrom utils.recipe import CPU_STRESS_S, CPU_STRESS_SAMPLE_S, CPU_TDP_Wdef cpu_stress_and_power(measurements, server, log): """All cores at 100 % for 10 min at the room's 25 C: package power per socket must reach the power limit and not exceed the TDP, the hottest core must stay under 85 C, the fan controller must end with headroom, and nothing may throttle. A heatsink with a missing thermal pad shows up as one socket hot and its package power capped under the other. The mock is time-scaled.""" t, pkg0, pkg1, temp, fan, throttles = server.os_stress_all_cores(CPU_STRESS_S, CPU_STRESS_SAMPLE_S) settled = np.asarray(t) >= CPU_STRESS_S / 2 # the second half, once the heatsinks are hot p0 = np.asarray(pkg0) p1 = np.asarray(pkg1) m = measurements.cpu_stress m.x_axis = t m.y_axis.package_0_w = pkg0 m.y_axis.package_0_w.aggregations.max_w = round(float(p0.max()), 1) m.y_axis.package_0_w.aggregations.settled_mean_w = round(float(p0[settled].mean()), 1) m.y_axis.package_1_w = pkg1 m.y_axis.package_1_w.aggregations.max_w = round(float(p1.max()), 1) m.y_axis.package_1_w.aggregations.settled_mean_w = round(float(p1[settled].mean()), 1) m.y_axis.hottest_core_c = temp m.y_axis.hottest_core_c.aggregations.max_c = max(temp) m.y_axis.fan_duty_pct = fan m.y_axis.fan_duty_pct.aggregations.end_pct = fan[-1] measurements.throttle_events = throttles log.info(f"{CPU_STRESS_S} s all-core (mock: instant): package {p0[settled].mean():.0f} / {p1[settled].mean():.0f} W settled against a {CPU_TDP_W:.0f} W TDP, hottest core {max(temp):.1f} C, fans at {fan[-1]:.0f} % at the end, {throttles} throttle events")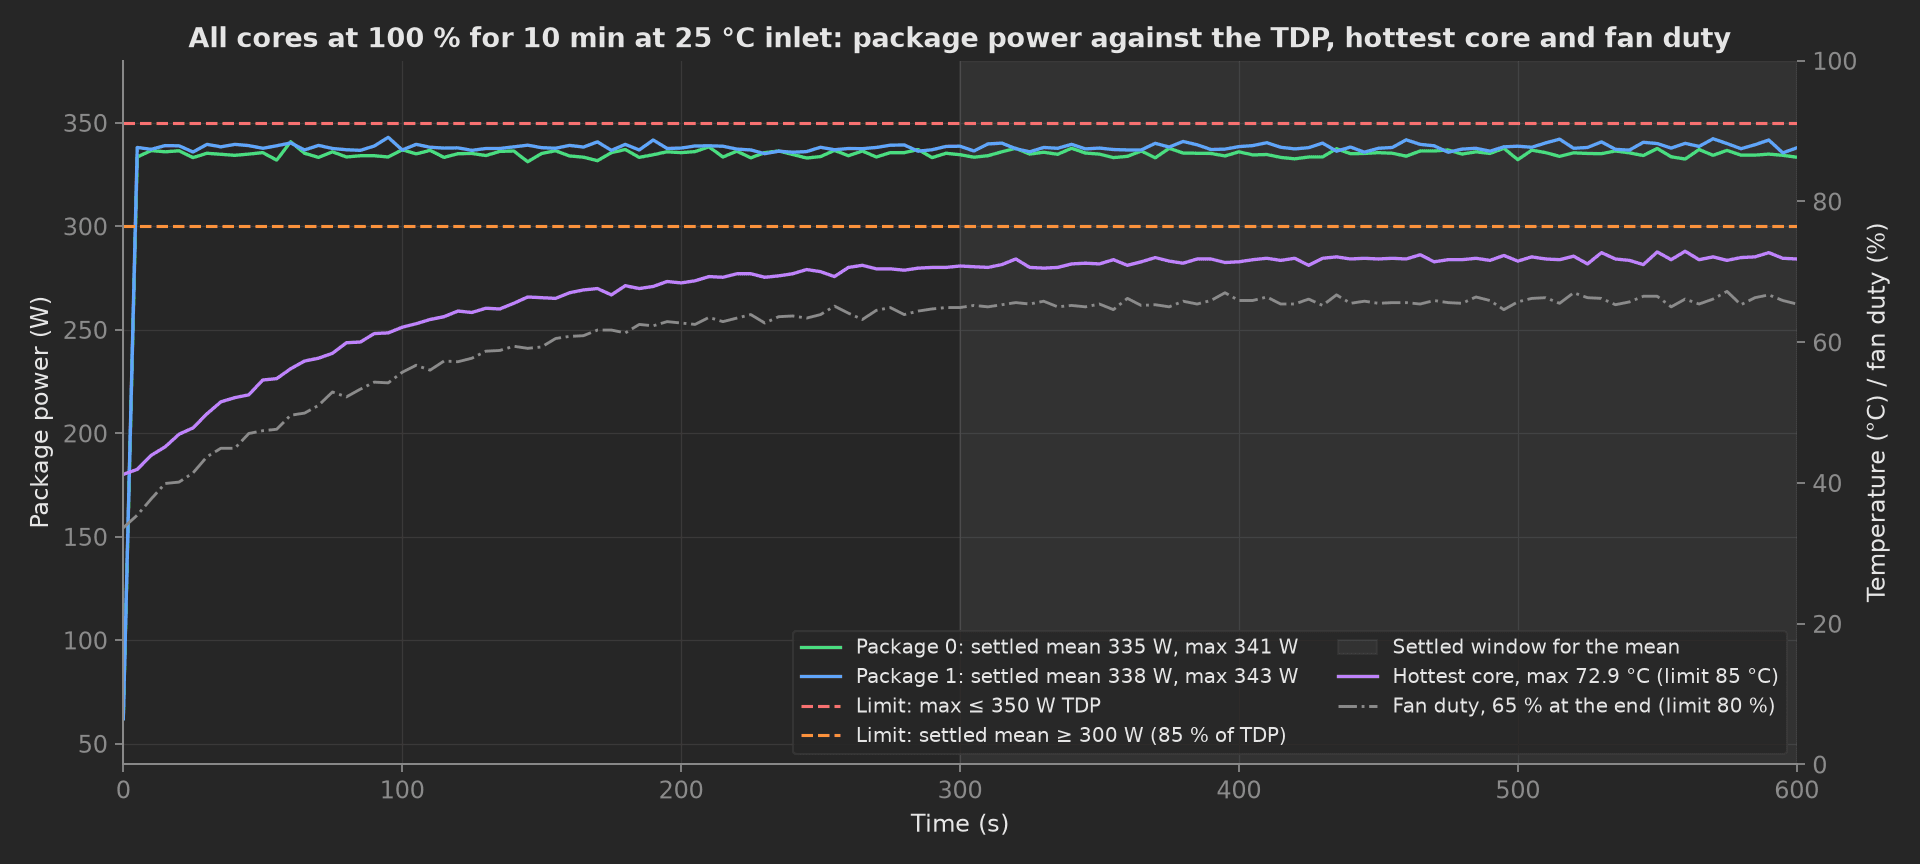
The mock's stress: both packages step from 62 W idle to 335 and 338 W and stay there, the hottest core climbs from 41 °C to 72.9 °C with a 90 s time constant, and the fans settle at 65 % duty. The settled window for the mean is the second half, once the heatsinks are hot.
Run-In
Twenty-four hours in the chamber at 40 °C inlet under the all-core load, the trace recorded whole and judged on the inlet window, the package power, the hottest core and the hottest drive. Then the counters that must not have moved, compared with what the earlier phases recorded: the phase receives memory_test and nvme_test as parameters and computes the correctable ECC delta per DIMM and the media-error delta per drive from their measurements, then reads the SEL, throttle and PSU redundancy counters. The mock is time-scaled; timeout: 24h is the framework's cap, and a line that needs the full 24 h with margin chains two 12 h phases, each reading the counters at its end.
phases/run_in.py50 lines
from utils.recipe import CPU_TDP_W, RUN_IN_AMBIENT_C, RUN_IN_HOURSdef run_in(measurements, server, run, memory_test, nvme_test, log): """24 h in the chamber at 40 C inlet under the all-core load, the trace recorded whole, then every counter compared with what memory_test and nvme_test recorded: correctable ECC per DIMM, media errors per drive, SEL entries, throttle and PSU redundancy events. The deltas are the result; the baselines come from the earlier phases through the framework, not from a file. The mock is time-scaled.""" run.metadata["run_in_hours"] = RUN_IN_HOURS run.metadata["run_in_ambient_c"] = RUN_IN_AMBIENT_C log.info(f"Run-in: {RUN_IN_HOURS:.0f} h at {RUN_IN_AMBIENT_C:.0f} C inlet under the all-core load (mock: instant)") r = server.run_in(RUN_IN_HOURS, RUN_IN_AMBIENT_C) m = measurements.run_in_trace m.x_axis = r["t_h"] m.y_axis.inlet_c = r["inlet_c"] m.y_axis.inlet_c.aggregations.min_c = min(r["inlet_c"]) m.y_axis.inlet_c.aggregations.max_c = max(r["inlet_c"]) m.y_axis.package_0_w = r["pkg0_w"] m.y_axis.package_0_w.aggregations.max_w = max(r["pkg0_w"]) m.y_axis.package_1_w = r["pkg1_w"] m.y_axis.package_1_w.aggregations.max_w = max(r["pkg1_w"]) m.y_axis.hottest_core_c = r["cpu_max_c"] m.y_axis.hottest_core_c.aggregations.max_c = max(r["cpu_max_c"]) m.y_axis.hottest_nvme_c = r["nvme_max_c"] m.y_axis.hottest_nvme_c.aggregations.max_c = max(r["nvme_max_c"]) ecc_before = list(memory_test.measurements.ecc_per_dimm.y_axis.correctable) ecc_after, _ = server.os_ecc_counters() ecc_delta = [a - b for a, b in zip(ecc_after, ecc_before)] d = measurements.ecc_delta_per_dimm d.x_axis = list(range(1, len(ecc_delta) + 1)) d.y_axis.correctable_delta = ecc_delta d.y_axis.correctable_delta.aggregations.max = max(ecc_delta) media_before = list(nvme_test.measurements.nvme_smart.y_axis.media_errors) media_after = [server.os_nvme_smart(i + 1)["media_errors"] for i in range(len(media_before))] media_delta = [a - b for a, b in zip(media_after, media_before)] n = measurements.media_error_delta_per_drive n.x_axis = list(range(1, len(media_delta) + 1)) n.y_axis.media_error_delta = media_delta n.y_axis.media_error_delta.aggregations.max = max(media_delta) measurements.sel_entries_added = r["sel_added"] measurements.throttle_events = r["throttle_events"] measurements.psu_redundancy_events = r["psu_redundancy_events"] log.info(f"Inlet {min(r['inlet_c']):.1f} to {max(r['inlet_c']):.1f} C, package max {max(r['pkg0_w']):.0f} / {max(r['pkg1_w']):.0f} W against {CPU_TDP_W:.0f} W, hottest core {max(r['cpu_max_c']):.1f} C, hottest NVMe {max(r['nvme_max_c']):.1f} C") log.info(f"Deltas over {RUN_IN_HOURS:.0f} h: ECC {sum(ecc_delta)} (baseline {sum(ecc_before)}), media errors {sum(media_delta)} (baseline {sum(media_before)}), SEL +{r['sel_added']}, throttles {r['throttle_events']}, PSU events {r['psu_redundancy_events']}")The deltas are the result. A DIMM that corrected nothing during the pattern test and 12 errors during the soak is a DIMM that fails with temperature, and its slot is named in the report; the same DIMM read as a total over 32 slots is a number nobody can act on.
Clear and Ship Config
The teardown clears the SEL the run-in wrote into, applies the shipping BIOS profile and checks its checksum and its boot configuration against the release, writes the MAC addresses and the serials of every DIMM and drive into the unit's metadata, and attaches the Redfish inventory as the as-shipped record. It runs whatever a main phase did, so a unit pulled for repair is never left with the test profile in its BIOS.
phases/clear_and_ship_config.py31 lines
import jsonimport tempfilefrom utils.recipe import SHIPPING_BIOS_PROFILEdef clear_and_ship_config(measurements, server, unit, attach, log): """Teardown: the SEL the run-in wrote into is cleared, the BIOS goes to the shipping profile and its checksum and boot configuration are checked, the MAC addresses and the serials of every DIMM and drive go into the unit's metadata, and the whole Redfish inventory is attached as the as-shipped record. Runs whatever a main phase did, so a unit pulled for repair is never left with the test profile in its BIOS.""" server.redfish_sel_clear() server.redfish_bios_apply_profile(SHIPPING_BIOS_PROFILE) checksum = server.redfish_bios_checksum() boot = server.redfish_boot_config() inventory = server.redfish_inventory() measurements.sel_entries_after_clear = server.redfish_sel_count() measurements.bios_checksum = checksum measurements.boot_config = boot for nic in inventory["network"]: unit.metadata[f"mac_port{nic['port']}"] = nic["mac"] unit.metadata["dimm_serials"] = ",".join(d["serial"] for d in inventory["memory"]) unit.metadata["nvme_serials"] = ",".join(d["serial"] for d in inventory["storage"]) with tempfile.NamedTemporaryFile("w", suffix=".json", delete=False) as f: json.dump(inventory, f, indent=2) attach.file(f.name, f"redfish-inventory-{unit.serial_number}.json") log.info(f"SEL cleared, BIOS {SHIPPING_BIOS_PROFILE} {checksum}, boot {boot['boot_order']} RAID {boot['raid']}, {len(inventory['memory'])} DIMM and {len(inventory['storage'])} NVMe serials in unit metadata, inventory attached")Mock Plug
ServerUnderTest stands in for the BMC's Redfish session and the test OS's SSH session because the run-in reads both at once, and plugs run in separate processes. Its firmware set is the golden one, its 32 DIMMs report 64 GB at 4800 MT/s, its links train at Gen5 x16 and x4, its STREAM triad saturates at 456 GB/s with a 22-thread time constant, its drives deliver 2.24 to 2.29 M IOPS and 12.9 to 13.1 GB/s with capacitor health between 104 and 111 %, its all-core load draws 335 and 338 W with a 90 s thermal time constant, and its chamber holds 40 °C with a 6 h drift of ±0.3 °C. Every method returns plain Python types because plug calls cross a JSON boundary; a measurement read back from measurements.<key> returns a proxy, so the phases keep locals for their log lines.
On a real line, split the class into the Redfish client and the SSH session, replace scripts/fio_precondition.py in the nvme_precondition command with the real fio invocation, drive the chamber from a plug of its own with scope: station if it is shared between stations, and read the throttle counters from turbostat or the BMC rather than a polled register. The phases, measurements and limits stay the same.