
Get the complete source, dependencies and setup instructions from the template repository.
Open the source on GitHubIntroduction
Rack Integration Overview
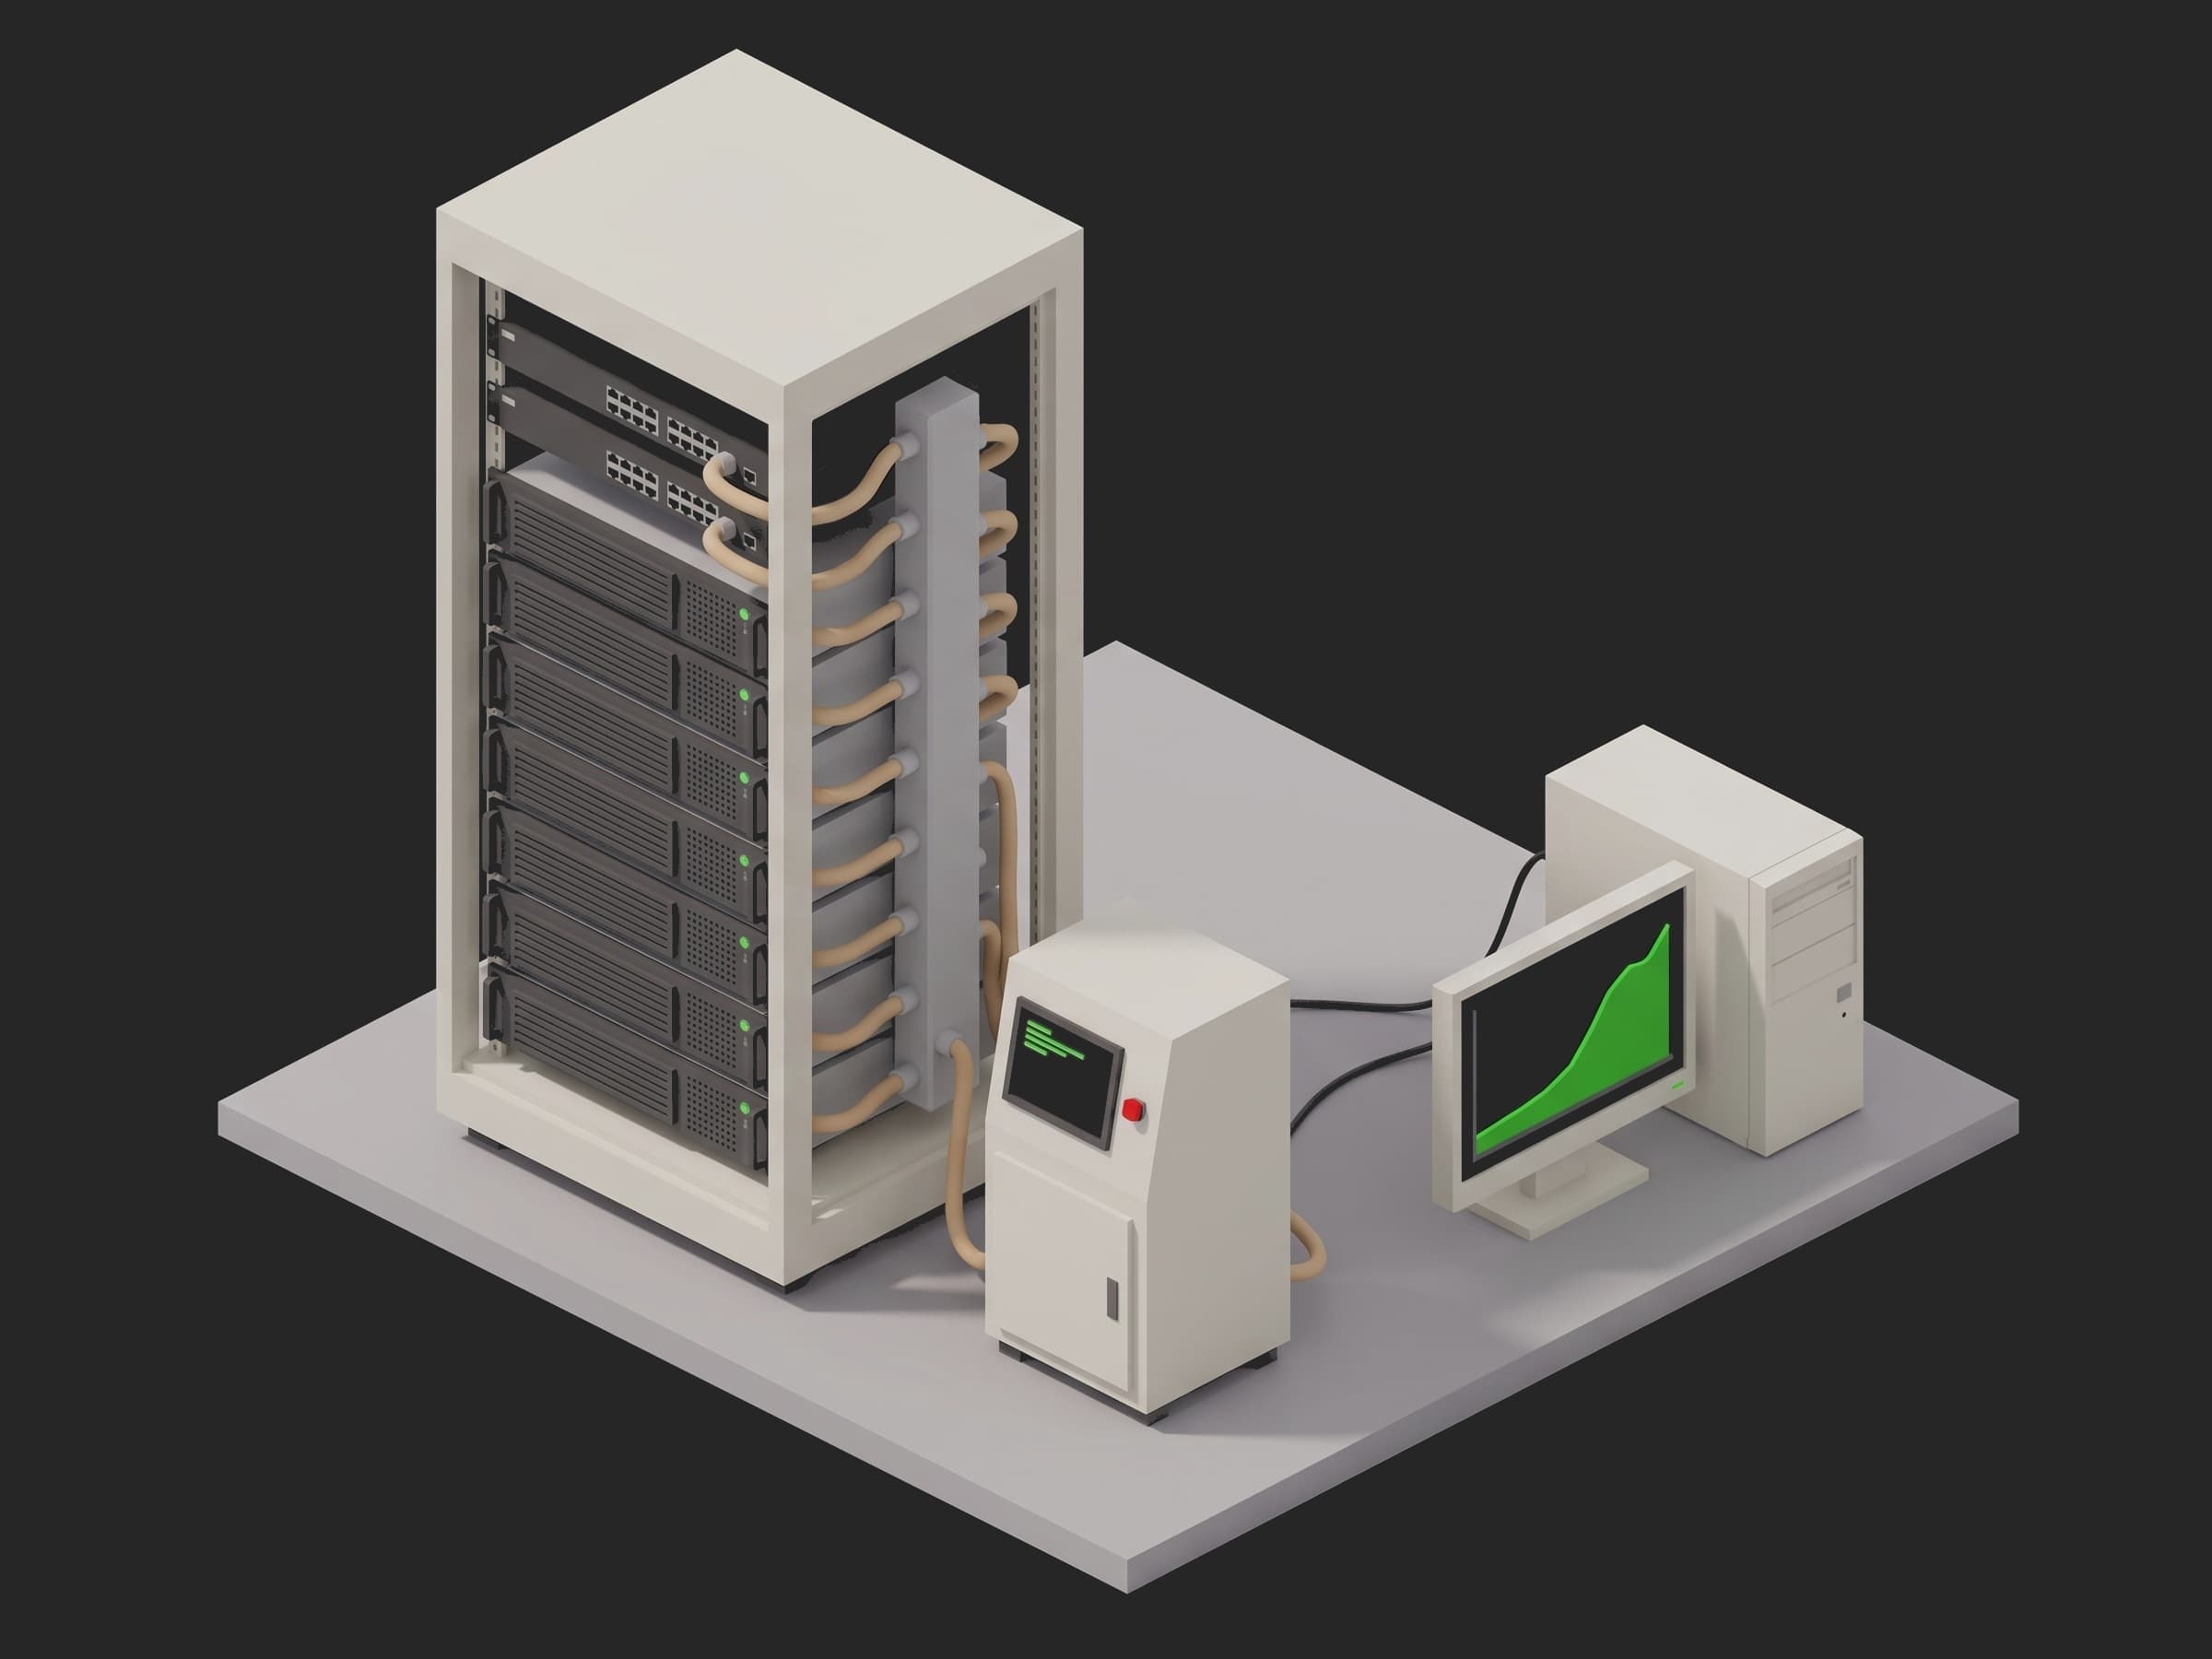
A GPU rack does not leave the integrator as eight servers. The OCP liquid cooling integration and logistics white paper defines the levels: L6 is a board in a chassis, L10 is a server that boots and passes its own witness test, L11 is that server racked with its network and its coolant manifold attached, and L12 adds the customer's software environment. L11 is where the rack becomes one unit: eight GPU nodes on the busbar of an ORV3 power shelf, two top-of-rack switches with 32 cables to the nodes, a manifold with 16 quick-disconnects and a CDU behind it. Everything that can go wrong between eight good servers and one good rack goes wrong here: a cable pair swapped between two nodes, a quick-disconnect that did not seat, a node whose BIOS was flashed before the release, a transceiver with a dirty endface, a branch of the manifold that starves one node.
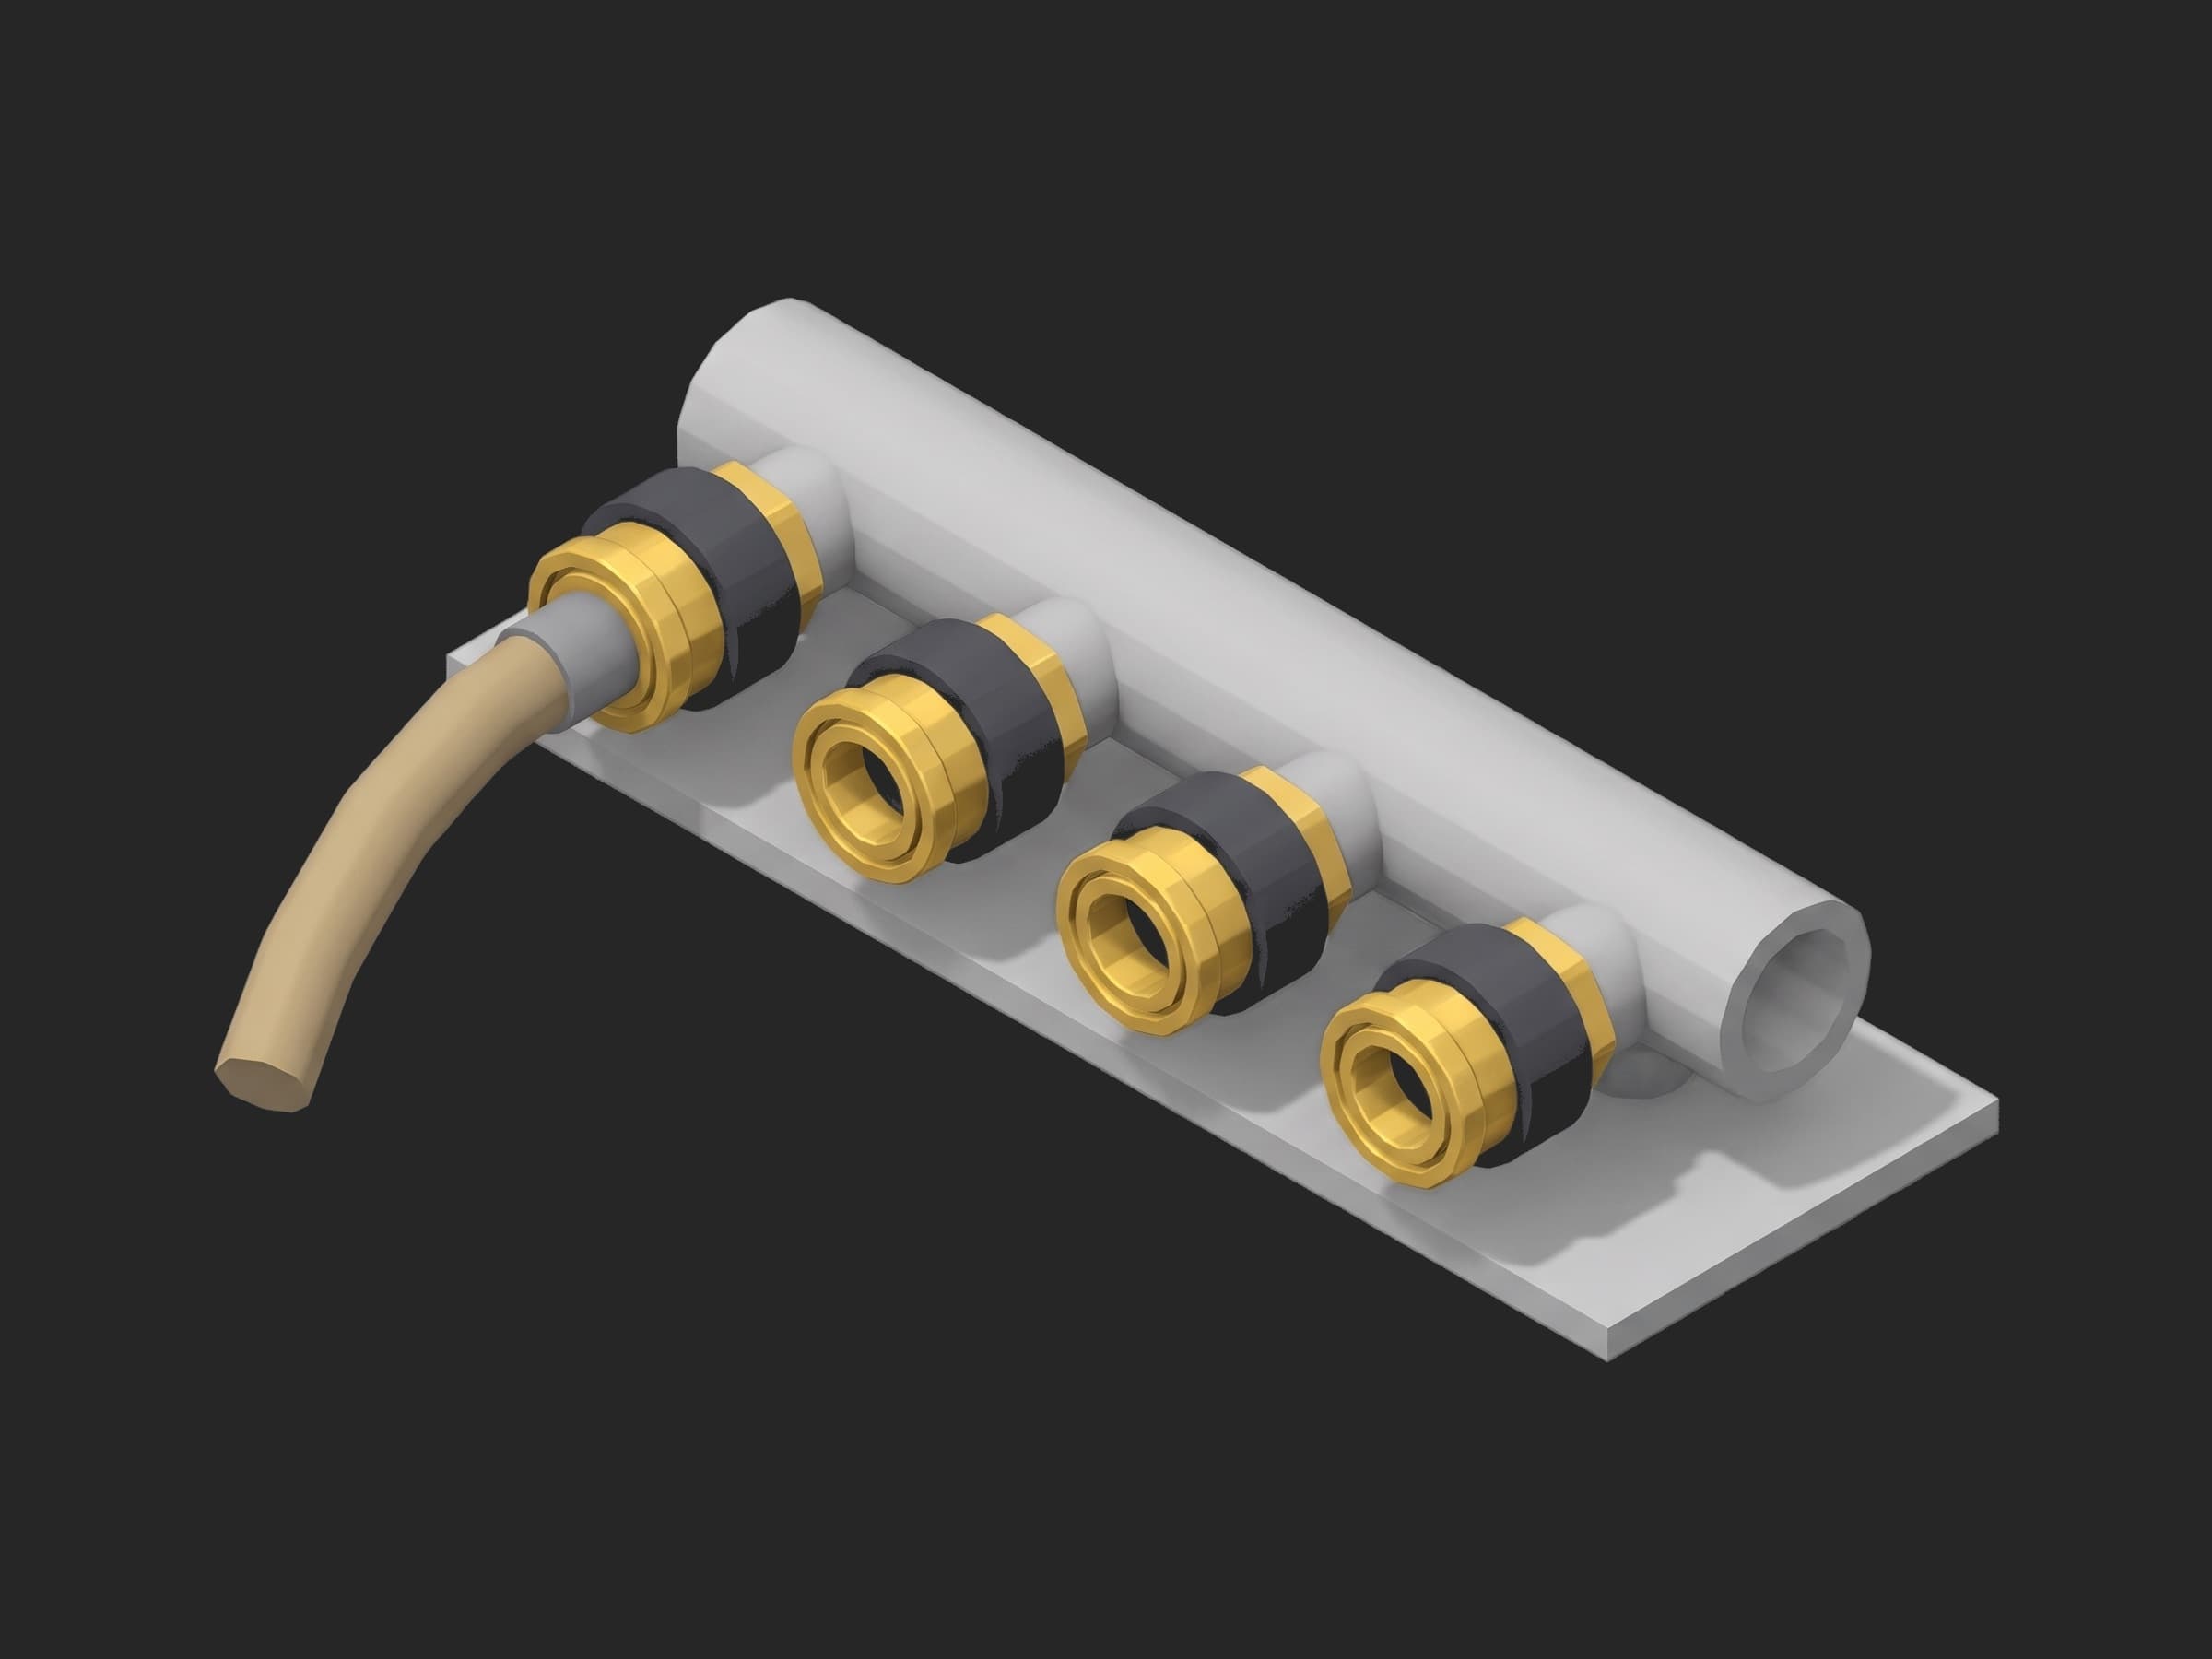
The parts this test exercises: the manifold and its quick-disconnects, the CDU and the coolant loop through eight sets of cold plates, the 32 fabric links between the nodes and the ToRs, the NVLink domain inside every node and the fabric between them, and the power shelf on the busbar.
There is no published specification for L11. The white paper puts a gaseous leak test of the servers, the manifold and the CDU before the fill, with nitrogen or forming gas and a hydrogen sniffer, and lets the rack ship wet or drained. The 0.5 % pressure-decay figure comes from the OCP cold plate development and qualification document, which cites EN 1779. The rack's coolant boundary comes from the Meta Catalina compute tray specification: PG25 at 40 °C supply, at most 100 LPM and 15 psi at the rack, 1.25 to 1.5 LPM per kW. The rest is integrator practice, consistent across the cluster acceptance guides: the cable map checked against LLDP, every port at rate with nothing uncorrected, the NVLink domain checked with nvidia-smi and nvbandwidth, NCCL all_reduce_perf at 90 to 95 % of theoretical, a 24 to 72 h soak with no throttling and no ECC growth, and a rack-loop pressure hold with no decay the transducer can see. Every limit in this template is one of those, or says whose derivation it is.
Test Purpose
The procedure records one integration fingerprint per rack:
- The build record read from the hardware: rack asset tag, elevation revision, node, switch and PSU serials as one object
- The cable map against the LLDP neighbour tables of both ToRs: mismatched, missing and extra links, and the negotiated speed on every mapped port
- A forming-gas pressure hold on the rack loop, judged on temperature-compensated decay, and the hydrogen reading at each of the 16 quick-disconnects
- The fill volume, the flow and inlet temperature at every node's branch, and the rack's total flow, pressure drop and supply temperature
- Nodes reachable after power-on, the inventory of every node collapsed into one object against the golden configuration, and the shelf's idle power
- FEC and PCS counters per port after 5 min at 400 GbE line rate, and frames lost
- NVLinks down and the all-reduce bus bandwidth across 64 ranks against the node NIC ceiling
- Per-node soak results over 24 h: hottest GPU, throttle events, ECC counters, and the leak sensors and the shelf's fault log
- At teardown, the loop state next to the operator's declaration, the shelf blackbox, the BMC event logs, and the final cable map attached as a report
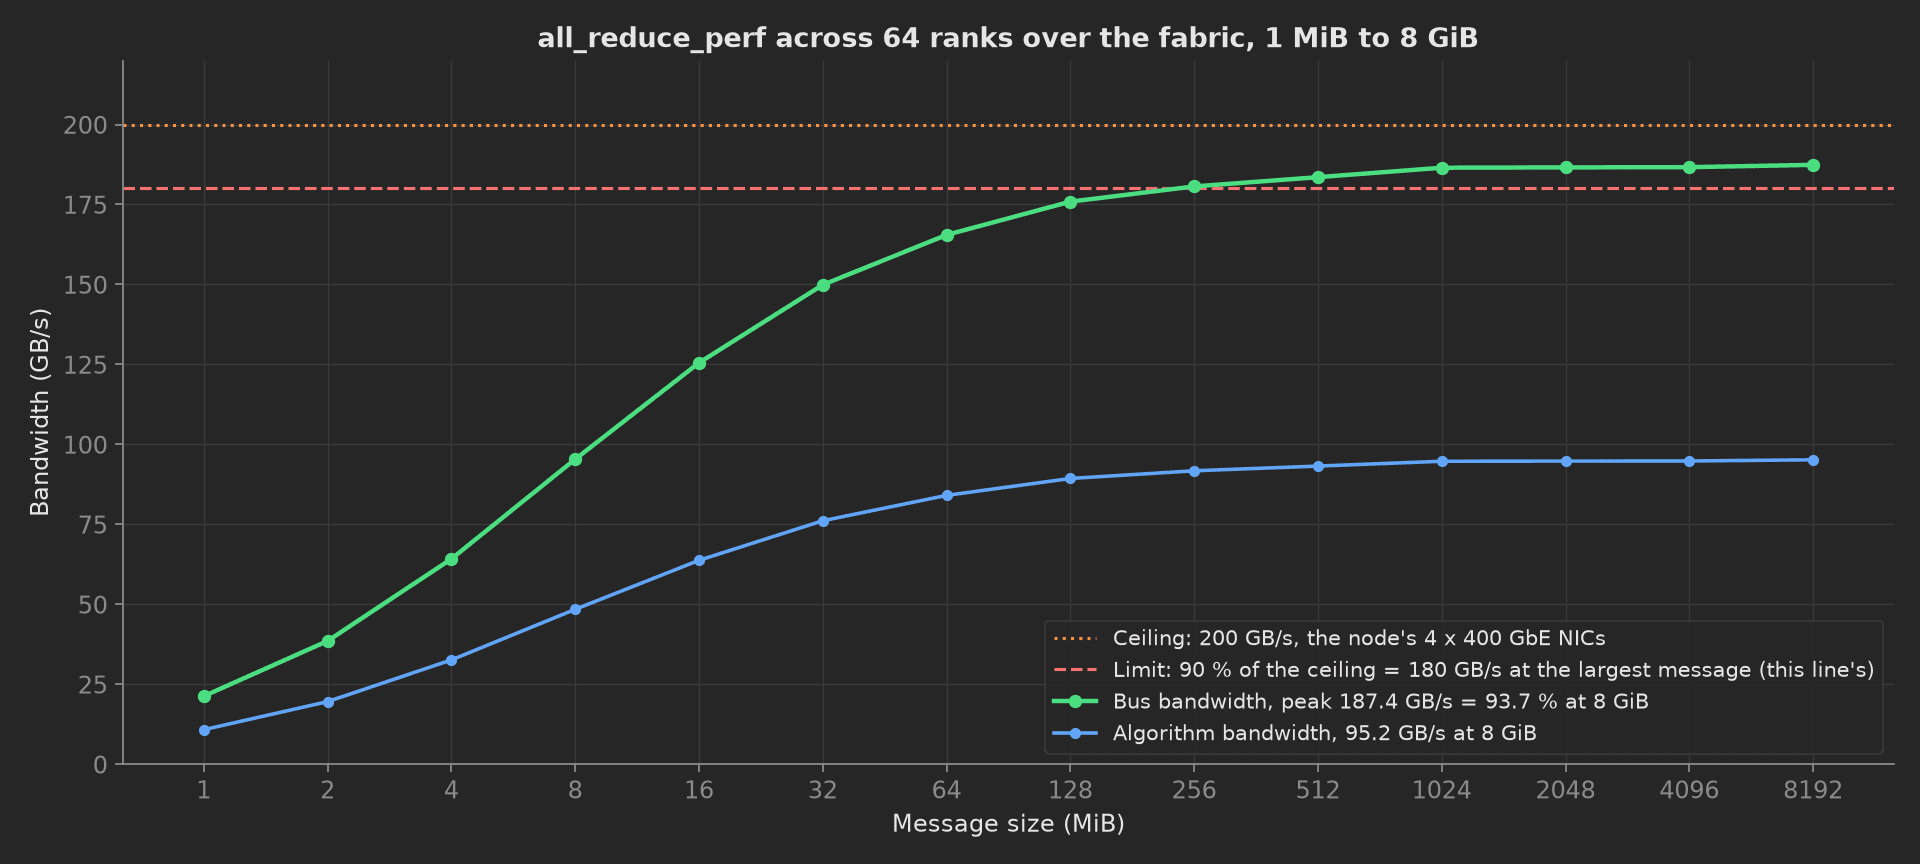
The mock rack's all-reduce sweep: bus bandwidth climbs out of the latency floor and plateaus at 187.4 GB/s, 93.7 % of the 200 GB/s that the node's four 400 GbE NICs can carry. The ceiling is the fabric's, not the GPUs': an inter-node ring cannot move more than the node's NICs, so the limit is stated as a fraction of that number.
The framework mechanics on show are a depends_on DAG where the cable check and the leak test run concurrently on different instruments while the fill waits on both; then: {fail: retry} with retry: {limit: 1} on the cable check, so one re-seat and re-run stays in the report; operator UI select and switch components bound to measurements in the teardown, validated with in and ==; attach.file of a report the phase wrote; JSON == on whole objects, including an inventory collapsed from eight nodes; and long phases time-scaled in the mock with timeout sized for the real ones.
Equipment & Setup
To run this integration on a rack line, the following are required:
- A forming-gas panel (95 % N2, 5 % H2) with a regulator, a shut-off valve and a gauge-pressure transducer on the manifold's supply stub, and a gas thermocouple on the return stub
- A hydrogen sniffer with a hand probe for the 16 quick-disconnects
- The rack's CDU, or a bench CDU on the rack's supply and return stubs, with a PG25 reservoir, a flow meter and a differential-pressure transducer, and per-branch flow meters and inlet thermistors on the manifold
- Management access to both ToRs for LLDP and the per-port PCS and FEC counters, and a traffic agent on every node for the run at rate
- Redfish access to the eight BMCs and the rack manager's API for the shelf and the leak sensors
- An SSH agent on every node with
nvidia-smi,nvbandwidth, NCCL tests and DCGM - The Device Under Test (DUT): an 8-node liquid-cooled AI rack after L10, cabled and plumbed, with its build record and its topology map
- A TofuPilot Framework procedure to sequence the gates and validate the limits
- The TofuPilot Dashboard to keep the per-rack evidence, the cable map and the soak history
Hardware Components
Leak Bench and CDU
The gaseous test needs a gas the sniffer can see and a pressure the loop can take: forming gas at 5 % hydrogen is non-flammable and an Inficon Sensistor Sentrac reads it to a fraction of a ppm above background. The transducer matters more than the gas: a 30 min hold at 200 kPa on a loop of 42 L moves a few hundredths of a kilopascal for a leak that would matter, so the phase averages the first and last minute and compensates the gas temperature before it computes the decay. The CDU is the rack's own or a bench unit on the same stubs; Vertiv and Motivair in-rack CDUs expose the supply set-point, flow and dP over Modbus TCP, and the manifold's per-branch turbine meters sit on the same bus.
A single-rack station: the rack on its casters with the manifold hosed to the nodes, the CDU beside it on the supply and return stubs, the production computer on the management network with both ToRs, the BMCs and the CDU.
Fabric and Node Tooling
The ToRs are 400 GbE switches whose management API returns LLDP neighbours and per-port RS(544,514) FEC counters: corrected codewords, uncorrected codewords and PCS symbol errors. A link that corrects a lot is a dirty endface or a marginal transceiver and still passes traffic; a link that has anything uncorrected is dropping frames. On the nodes, nvidia-smi nvlink -s and nvbandwidth cover the NVLink domain, nccl-tests all_reduce_perf covers the fabric between nodes, and DCGM diagnostics at the power limit cover the soak with the temperature, throttle and ECC counters the phase records.
Where the Limits Come From
| Test | Limit | Basis |
|---|---|---|
| Build record | exact match | no tolerance applies |
| Cable map | 0 mismatched, 0 missing, 0 extra, every mapped port at 400 Gb/s | integrator practice (LLDP against the topology map) |
| Pressure hold | ≤ 0.5 % decay over 30 min at 200 kPa, gas drift within ±1 °C | OCP cold plate qualification, EN 1779; the hold pressure is this loop's MOP; the drift window is this line's |
| Hydrogen at QDs | ≤ 5 ppm above background | this line's: ten times the sniffer's noise floor |
| Fill volume | 42 L ± 10 % | the rack's design volume; the tolerance is this line's |
| Node flow | ≥ 8.75 LPM per node | Catalina: 1.25 LPM/kW × 7 kW of heat to liquid per node |
| Rack flow, dP | ≤ 100 LPM, ≤ 15 psi | Catalina rack boundary |
| Supply, inlets | 40 °C ± 2 | Catalina: 40 °C PG25 supply; ±2 °C is this line's |
| Inventory | exact match to the golden configuration, 8 nodes, 64 GPUs | no tolerance applies |
| Idle power | 8 to 14 kW | this line's window for eight nodes and two switches |
| Ports at rate | ≥ 99 % of line rate, ≤ 1,000,000 corrected codewords per port in 5 min, 0 uncorrected, 0 symbol errors, 0 frames lost | integrator practice for the zeros; the corrected ceiling is this line's, about 8e-9 pre-FEC BER, four decades under the 2.4e-4 budget of the code |
| NCCL | ≥ 180 GB/s = 90 % of the 200 GB/s node NIC ceiling at the largest message, 0 NVLinks down | integrator practice quotes 90 to 95 % of theoretical; the ceiling is the node's 4 × 400 GbE |
| Soak | hottest GPU ≤ 85 °C, 0 throttle events, 0 uncorrectable ECC, 0 leak events, 0 PSU faults over 24 h | integrator practice for the zeros; 85 °C is this line's, 5 °C under the GPU's slowdown threshold |
| Ship prep | loop state and declaration each in [wet, drained], QDs capped, blackbox and SEL empty | this line's |
Two rows deserve a note. The pressure-decay limit is a cold-plate qualification figure applied to a rack loop: the loop is a hundred times the plate's volume, so 0.5 % of it is a large leak, and the practice on this line is zero decay within the transducer's resolution, with the 0.5 % as the number the report validates. The NCCL ceiling is the node NIC bandwidth and not the GPU's NVLink bandwidth: in a ring across nodes every rank sends the same amount, and one rank per node per ring sends it over a NIC, so the bus bandwidth cannot exceed what the node's NICs carry.
Test Procedure
Overview
The procedure maps the integration onto the framework's three stages. The build record lives in setup: so nothing proceeds on a rack that is not the one on the drawing. The cable map and the leak test are the first two main phases with no dependency between them: one runs on the ToRs, the other on the gas panel, and the fill waits for both. From the fill on, the chain is sequential because each phase needs the last one's state: coolant before power, power before traffic, traffic before NCCL, NCCL before the soak. Ship prep lives in teardown: so the CDU goes into ship mode and the cable map is attached whatever happened.
- Setup: build record from the hardware, one object.
- Main: LLDP tables against the topology map, one retry after a re-seat.
- Main, concurrent with 2: forming-gas hold and hydrogen sniff at 16 QDs.
- Main: PG25 fill, flow and inlet temperature per node, rack boundary.
- Main: power-on, inventory collapsed against the golden set, idle power.
- Main: 32 ports at rate for 5 min, FEC and PCS counters.
- Main: NVLink status, all-reduce sweep against the NIC ceiling.
- Main: 24 h soak, per node.
- Teardown: loop state, declaration, blackbox, SEL, cable map attached.
Every metric validates against limits declared in procedure.yaml, and results stream to TofuPilot as the per-rack evidence.
Why TofuPilot Framework?
TofuPilot Framework is a YAML + Python test framework built for hardware manufacturing. Instead of writing all your test logic, measurements, and limits inside Python code, you describe what the test does in a procedure.yaml file, and how in small Python phase files. The framework handles:
- Automatic Python environment management (via
uv) - Operator UI (no frontend code needed)
- Measurement validation and live charts
- Process isolation between phases and equipment plugs
Project Structure
You can find the full source on GitHub. The four plugs are mocks of the rack manager with the BMCs and the shelf, the two ToRs with the node traffic agents, the leak bench, and the CDU with the manifold instrumentation, synthesizing a rack built to its record: a tight loop, eight branches within 10 % of each other, FEC correcting a healthy number of codewords with nothing uncorrected, 93.7 % of the all-reduce ceiling and a soak with the hottest GPU at 78.7 °C, so the procedure runs end-to-end without a rack connected.
tofupilot run .For CI or bench automation, the same run executes headless, with the operator's ship-prep answers pre-baked in ui.json:
tofupilot run . --no-tui --no-kiosk --json --ui-values ui.json --ui-timeout 60The Procedure File
procedure.yaml429 lines
name: Rack L11 Integration Testversion: 0.1.0description: L11 integration of a liquid-cooled AI rack, eight GPU nodes, two ToR switches and an ORV3 power shelf on a 48 V busbar, racked with the network and the coolant manifold attached. Build record against the hardware, cable map against LLDP with one re-seat retry, gaseous leak test of the rack loop before the fill, PG25 fill and per-node flow against the CDU boundary, power-on and inventory against the golden configuration, every port at rate with zero uncorrected errors, NCCL all-reduce against the node NIC ceiling, a 24 h soak with nothing growing, and a ship-prep teardown that records the loop state and attaches the final cable map.unit: auto_identify: true serial_number: description: "Scan the rack asset label on the front door" placeholder: "RACK-AI8-00000" pattern: "^RACK-AI8-\\d{5}$" default_value: "RACK-AI8-00217" part_number: default_value: "AIR-8N-2T-LC" batch_number: default_value: "BUILD-2026-38"plugs: - name: Rack Manager description: "Rack manager, the eight BMCs over Redfish, the power shelf's Modbus port and a node agent for the GPU tooling (mock)" python: plugs.rack_manager:RackManager key: rack config: address: "10.0.0.10" - name: Fabric description: "Both ToR switches' management API and the node traffic agents (mock)" python: plugs.fabric:Fabric key: fabric config: tor1: "10.0.0.11" tor2: "10.0.0.12" - name: Leak Bench description: "Forming-gas panel, pressure and gas-temperature transducers, hydrogen sniffer (mock); station scoped because the sniffer's warm-up outlasts a rack's test" python: plugs.leak_bench:LeakBench key: leak scope: station config: gas_panel: "/dev/ttyUSB0" sniffer: "/dev/ttyUSB1" - name: CDU description: "In-rack CDU, manifold branch flow meters and inlet thermistors, leak-rope sensors (mock)" python: plugs.cdu:Cdu key: cdu config: address: "10.0.0.20"setup: - name: Rack Identity key: rack_identity python: phases.rack_identity measurements: - name: Build Record key: build_record description: "Rack asset tag, elevation drawing revision, node, switch and PSU serials read from the hardware, as one object against the build record." validators: - operator: "==" expected_value: rack: RACK-AI8-00217 elevation_rev: C nodes: [N8G-26-04117, N8G-26-04118, N8G-26-04119, N8G-26-04120, N8G-26-04121, N8G-26-04122, N8G-26-04123, N8G-26-04124] switches: [TOR-26-00871, TOR-26-00872] psus: [ORV3-12K-004217, ORV3-12K-004218, ORV3-12K-004221, ORV3-12K-004224, ORV3-12K-004230, ORV3-12K-004231] - name: Rack Serial Matches Label key: rack_serial_matches_label description: The asset tag the rack manager reports is the one scanned on the door. validators: - {operator: "==", expected_value: true}main: - name: Cabling Verification key: cabling_verification python: phases.cabling_verification retry: limit: 1 then: fail: retry measurements: - name: Link Mismatches key: link_mismatches description: "Mapped ports whose LLDP neighbour is another node or another NIC: a swapped pair of cables." validators: - {operator: "==", expected_value: 0} - name: Missing Links key: missing_links description: "Mapped ports with no LLDP neighbour: an unseated cable or a dead transceiver." validators: - {operator: "==", expected_value: 0} - name: Extra Links key: extra_links description: "Ports off the map that have a neighbour." validators: - {operator: "==", expected_value: 0} - name: Link Speed key: link_speed title: Expected and negotiated speed on the 32 mapped ToR ports x_axis: legend: Mapped port y_axis: - legend: Expected key: expected_gbps unit: Gb/s - legend: Seen key: seen_gbps unit: Gb/s aggregations: - type: ports_below_expected validators: - {operator: "==", expected_value: 0} - name: Gaseous Leak key: gaseous_leak python: phases.gaseous_leak timeout: 60m measurements: - name: Pressure Hold key: pressure_hold title: Rack loop at 200 kPa of forming gas, 30 min hold after a 10 min settle x_axis: legend: Time unit: min y_axis: - legend: Gauge pressure key: pressure_kpa unit: kPa aggregations: - type: decay_pct unit: "%" validators: - {operator: "<=", expected_value: 0.5} - type: hold_start_kpa unit: kPa validators: - {operator: ">=", expected_value: 195.0} - legend: Gas temperature key: gas_temp_c unit: °C aggregations: - type: drift_c unit: °C validators: - {operator: ">=", expected_value: -1.0} - {operator: "<=", expected_value: 1.0} - name: QD Sniff key: qd_sniff title: Hydrogen at each of the 16 quick-disconnects x_axis: legend: Quick-disconnect y_axis: - legend: H2 above background key: h2_ppm unit: ppm aggregations: - type: max_ppm unit: ppm validators: - {operator: "<=", expected_value: 5.0} - name: Fill and Flow key: fill_and_flow python: phases.fill_and_flow depends_on: [gaseous_leak, cabling_verification] measurements: - name: Fill Volume key: fill_volume_l unit: L description: "Litres taken from the reservoir to fill the loop, against the 42 L design volume +-10 %. A short fill is a node whose quick-disconnects did not open." validators: - {operator: ">=", expected_value: 37.8} - {operator: "<=", expected_value: 46.2} - name: Node Flow key: node_flow title: Coolant flow and inlet temperature at each node's manifold branch x_axis: legend: Node y_axis: - legend: Flow key: flow_lpm unit: LPM aggregations: - type: min_lpm unit: LPM validators: - {operator: ">=", expected_value: 8.75} - type: min_lpm_per_kw unit: LPM/kW validators: - {operator: ">=", expected_value: 1.25} - legend: Inlet temperature key: inlet_c unit: °C aggregations: - type: max_c unit: °C validators: - {operator: "<=", expected_value: 42.0} - type: min_c unit: °C validators: - {operator: ">=", expected_value: 38.0} - name: Rack Flow key: rack_flow_lpm unit: LPM description: "Total at the CDU, inside the 100 LPM rack boundary (Catalina)." validators: - {operator: "<=", expected_value: 100.0} - name: Rack Pressure Drop key: rack_dp_psi unit: psi description: "Supply to return across the rack at the CDU, inside the 15 psi boundary (Catalina)." validators: - {operator: "<=", expected_value: 15.0} - name: Supply Temperature key: supply_c unit: °C description: "40 C PG25 supply (Catalina), +-2 C is this line's." validators: - {operator: ">=", expected_value: 38.0} - {operator: "<=", expected_value: 42.0} - name: Power-On and Inventory key: power_on_inventory python: phases.power_on_inventory depends_on: [fill_and_flow] measurements: - name: Nodes Reachable key: nodes_reachable validators: - {operator: "==", expected_value: 8} - name: Rack Inventory key: rack_inventory description: "Every node's BIOS, BMC, VBIOS and NIC firmware and its GPU and DIMM counts, collapsed into one object: a field that differs between nodes becomes a list and fails the match on that key." validators: - operator: "==" expected_value: bios: 2.4.1 bmc: 1.12.0 vbios: 96.00.89.00.01 nic_fw: 28.41.1000 gpus: 8 dimm_gb: 2048 - name: GPUs Seen key: gpus_seen validators: - {operator: "==", expected_value: 64} - name: Idle Power key: idle_power_kw unit: kW description: "Shelf output with every node at the OS prompt, this line's window for eight nodes and two switches." validators: - {operator: ">=", expected_value: 8.0} - {operator: "<=", expected_value: 14.0} - name: Network at Rate key: network_at_rate python: phases.network_at_rate depends_on: [power_on_inventory] timeout: 15m measurements: - name: Port Counters key: port_counters title: Every mapped port at 400 GbE line rate for 5 min, counters cleared before and read after x_axis: legend: Mapped port y_axis: - legend: Line rate achieved key: line_rate_pct unit: "%" aggregations: - type: min_pct unit: "%" validators: - {operator: ">=", expected_value: 99.0} - legend: FEC corrected codewords key: fec_corrected aggregations: - type: max_per_port validators: - {operator: "<=", expected_value: 1000000} - legend: FEC uncorrected codewords key: fec_uncorrected aggregations: - type: total validators: - {operator: "==", expected_value: 0} - legend: PCS symbol errors key: symbol_errors aggregations: - type: total validators: - {operator: "==", expected_value: 0} - name: Frames Lost key: frames_lost description: "Sent minus received across every pair over the 5 min." validators: - {operator: "==", expected_value: 0} - name: NCCL Cluster key: nccl_cluster python: phases.nccl_cluster depends_on: [network_at_rate] timeout: 30m measurements: - name: NVLinks Down key: nvlink_links_down description: "nvidia-smi nvlink -s on all 64 GPUs; a link down halves a node's NVLink domain." validators: - {operator: "==", expected_value: 0} - name: All-Reduce key: all_reduce title: all_reduce_perf across 64 ranks over the fabric, 1 MiB to 8 GiB x_axis: legend: Message size unit: MiB y_axis: - legend: Bus bandwidth key: busbw_gbs unit: GB/s aggregations: - type: peak_gbs unit: GB/s validators: - {operator: ">=", expected_value: 180.0} - type: pct_of_ceiling unit: "%" validators: - {operator: ">=", expected_value: 90.0} - legend: Algorithm bandwidth key: algbw_gbs unit: GB/s - name: Soak key: soak python: phases.soak depends_on: [nccl_cluster] measurements: - name: Node Soak key: node_soak title: 24 h at the power limit, per node x_axis: legend: Node y_axis: - legend: Hottest GPU key: max_gpu_temp_c unit: °C aggregations: - type: max_c unit: °C validators: - {operator: "<=", expected_value: 85.0} - legend: Throttle events key: throttle_events aggregations: - type: total validators: - {operator: "==", expected_value: 0} - legend: ECC uncorrectable key: ecc_uncorrectable aggregations: - type: total validators: - {operator: "==", expected_value: 0} - legend: ECC corrected key: ecc_corrected - name: Leak Sensor Events key: leak_sensor_events description: "Leak-rope and drip-tray events since the fill." validators: - {operator: "==", expected_value: 0} - name: PSU Faults key: psu_faults description: "Fault entries across the shelf's six modules over the soak." validators: - {operator: "==", expected_value: 0}teardown: - name: Ship Prep key: ship_prep python: phases.ship_prep ui: components: - key: ship_state type: select label: "Ship state" description: "Per the shipping order: wet ships the loop full of PG25 with the stubs capped; drained ships it blown down" required: true bind: measurements.ship_state options: - {label: "Wet, loop filled", value: wet} - {label: "Drained, loop blown down", value: drained} - key: qds_capped type: switch label: "All 16 quick-disconnects and both stubs capped" description: "Dust caps on every node QD and the supply and return stubs" required: true bind: measurements.qds_capped measurements: - name: Ship State key: ship_state description: "The operator's declaration, from the shipping order." validators: - {operator: in, expected_value: [wet, drained]} - name: Loop State key: loop_state description: "What the CDU's level sensor says is in the loop: wet above 90 % of the design volume, drained under 5 %, partial in between. Read it next to the declaration." validators: - {operator: in, expected_value: [wet, drained]} - name: Coolant In Loop key: coolant_in_loop_l unit: L - name: QDs Capped key: qds_capped validators: - {operator: "==", expected_value: true} - name: Shelf Blackbox key: shelf_blackbox description: "The six modules' blackbox counters summed. A rack that ships with an AC loss or a trip in its log has a story the customer will ask about." validators: - operator: "==" expected_value: ac_loss: 0 ovp: 0 ocp: 0 otw: 0 otp: 0 fan: 0 - name: SEL Critical Entries key: sel_critical description: "System event log entries of severity Critical across the eight BMCs since power-on." validators: - {operator: "==", expected_value: 0}Framework features to notice:
- Two gates on two instruments, one fill.
cabling_verificationandgaseous_leakdeclare no dependencies, so they start together, one on the ToRs and one on the gas panel;fill_and_flowdeclaresdepends_on: [gaseous_leak, cabling_verification]and waits for both. Everything after the fill chains on the phase before it. - One re-seat, kept in the report.
cabling_verificationhasretry: {limit: 1}andthen: {fail: retry}: a swapped or unseated cable fails the first attempt, the operator re-seats what the log lists, the phase runs again, and the dashboard keeps both attempts with their measurements. - Operator answers as measurements. The teardown's
selectbinds toship_stateand itsswitchtoqds_capped; the answers are validated withinand==like any other measurement, andui.jsonpre-bakes them for headless runs. The CDU's own reading of the loop is recorded next to the declaration. - A report attached by the phase.
ship_prepwrites the final cable map, the LLDP table and their diff to a file and callsattach.file, so the rack's run carries the map it shipped with. - Eight nodes, one object.
rack_inventorycollapses the inventory of every node into one dict: a field that agrees across nodes keeps its value, a field that differs becomes a list and fails the==on that key.build_recordandshelf_blackboxuse the same==. - Long tests, time-scaled. The 30 min hold, the 5 min run at rate and the 24 h soak are instant in the mock;
timeoutis sized for the real leak test, network run and NCCL sweep, and the soak carries none because 24 h is the framework's cap. - A station-scoped plug. The leak bench is
scope: stationso the sniffer, whose warm-up outlasts a rack's test, stays open between racks.
Rack Identity
The setup phase reads the rack's asset tag and elevation revision from the rack manager, the node serials from the BMC FRUs, the switch serials from their management API and the PSU serials from the shelf, and records all of it as one object against the build record. A node from another rack, a shelf missing a module or a rack built to the previous elevation revision fails here, before any gas, coolant or power goes in. The elevation revision is stamped on the unit metadata.
from utils.recipe import NODES, PSU_MODULES, TORSdef rack_identity(measurements, rack, unit, log): """Setup: what is in the rack, read from the hardware, against the build record. Rack asset tag, elevation revision, eight node serials, two switch serials and six PSU serials as one object: a node from another rack, or a shelf missing a module, fails here before any coolant or power goes in.""" labels = rack.read_build_labels() measurements.build_record = labels measurements.rack_serial_matches_label = labels["rack"] == unit.serial_number unit.metadata["elevation_rev"] = labels["elevation_rev"] log.info(f"{labels['rack']} elevation rev {labels['elevation_rev']}: {len(labels['nodes'])}/{NODES} nodes, {len(labels['switches'])}/{TORS} switches, {len(labels['psus'])}/{PSU_MODULES} PSUs read; label {unit.serial_number}")Cabling Verification
Both ToRs' LLDP neighbour tables against the topology map in utils/topology.py, which lists the node and NIC every ToR port should see and at what speed. The phase counts mismatched, missing and extra links, records expected and seen speed per mapped port as a multi-dimensional measurement, and logs every discrepancy in the words the operator needs to re-seat it. On a fail the framework runs it once more.
phases/cabling_verification.py27 lines
from utils.recipe import PORTSfrom utils.topology import diff, speedsdef cabling_verification(measurements, fabric, log): """LLDP neighbour tables from both ToRs against the topology map. A swapped pair of cables is a mismatch, an unseated one is a missing link, and a port that came up below 400 GbE is a dirty or wrong transceiver. On a fail the phase retries once after the operator re-seats what it lists.""" seen = fabric.lldp_table() d = diff(seen) expected, actual = speeds(seen) for m in d["mismatched"]: log.warning(f"{m['expected']['tor']} {m['expected']['port']}: expected {m['expected']['node']} {m['expected']['nic']}, saw {m['seen']['node']} {m['seen']['nic']}") for e in d["missing"]: log.warning(f"{e['tor']} {e['port']}: no neighbour, expected {e['node']} {e['nic']}") below = sum(1 for e, a in zip(expected, actual) if a < e) measurements.link_mismatches = len(d["mismatched"]) measurements.missing_links = len(d["missing"]) measurements.extra_links = len(d["extra"]) m = measurements.link_speed m.x_axis = list(range(1, PORTS + 1)) m.y_axis.expected_gbps = expected m.y_axis.seen_gbps = actual m.y_axis.seen_gbps.aggregations.ports_below_expected = below log.info(f"{len(seen)} neighbours on {PORTS} mapped ports: {len(d['mismatched'])} mismatched, {len(d['missing'])} missing, {len(d['extra'])} extra, {below} below 400 GbE")The map and the diff are plain Python so the report can carry them:
utils/topology.py41 lines
"""The rack's topology map: which ToR port carries which node NIC at whatspeed, and the diff of an LLDP neighbour table against it."""from utils.recipe import BUILD_RECORD, NODES, PORT_GBPS, PORTS_PER_NODEdef expected_links(): links = [] for n in range(NODES): for nic in range(PORTS_PER_NODE): tor = nic // 2 + 1 # eth0 and eth1 on ToR 1, eth2 and eth3 on ToR 2 port = 2 * n + nic % 2 + 1 # ToR ports 1 to 16 links.append({"tor": f"tor{tor}", "port": f"Ethernet{port}", "node": BUILD_RECORD["nodes"][n], "nic": f"eth{nic}", "gbps": PORT_GBPS}) return linksEXPECTED_LINKS = expected_links()def diff(seen): """A map row is mismatched when the neighbour on that port is not the node and NIC the map expects, missing when the port has no neighbour; a row is extra when a port off the map has one.""" by_port = {(r["tor"], r["port"]): r for r in seen} mismatched = [] missing = [] for e in EXPECTED_LINKS: s = by_port.pop((e["tor"], e["port"]), None) if s is None: missing.append(e) elif (s["node"], s["nic"]) != (e["node"], e["nic"]): mismatched.append({"expected": e, "seen": s}) return {"mismatched": mismatched, "missing": missing, "extra": list(by_port.values())}def speeds(seen): """Expected and seen speed per map row, in map order; 0 when the port has no neighbour.""" by_port = {(r["tor"], r["port"]): r for r in seen} expected = [e["gbps"] for e in EXPECTED_LINKS] actual = [by_port.get((e["tor"], e["port"]), {}).get("gbps", 0) for e in EXPECTED_LINKS] return expected, actualGaseous Leak
The rack loop, empty, is charged with forming gas to 200 kPa and left 10 min for the compression heating to settle, then held 30 min with pressure and gas temperature sampled every 10 s. The phase averages the first and last minute, corrects the end pressure to the start temperature through the ideal gas law, and records the decay as an aggregation on the trace. Then the hydrogen sniffer visits all 16 quick-disconnects and the loop is vented.
phases/gaseous_leak.py37 lines
import numpy as npfrom utils.recipe import ATM_KPA, FORMING_GAS, HOLD_MIN, QD_COUNT, SAMPLE_S, STABILISE_MIN, TEST_PRESSURE_KPAdef gaseous_leak(measurements, leak, log): """Rack loop pressurised with forming gas before any coolant goes in, a 30 min hold judged on temperature-compensated decay, then the hydrogen sniffer at all 16 quick-disconnects. The hold is time-scaled in the mock.""" leak.pressurise(TEST_PRESSURE_KPA) log.info(f"{FORMING_GAS} to {TEST_PRESSURE_KPA:.0f} kPa gauge, {STABILISE_MIN} min to settle (mock: instant)") leak.stabilise(STABILISE_MIN) t_min, p_kpa, temp_c = leak.hold_trace(HOLD_MIN, SAMPLE_S) p = np.asarray(p_kpa) tk = np.asarray(temp_c) + 273.15 n = int(60 / SAMPLE_S) # first and last minute averaged against the transducer noise p0 = float(p[:n].mean()) p_end_corrected = float(((p[-n:] + ATM_KPA) * tk[:n].mean() / tk[-n:].mean() - ATM_KPA).mean()) decay_pct = 100.0 * (p0 - p_end_corrected) / p0 drift_c = float(np.asarray(temp_c)[-n:].mean() - np.asarray(temp_c)[:n].mean()) m = measurements.pressure_hold m.x_axis = t_min m.y_axis.pressure_kpa = p_kpa m.y_axis.pressure_kpa.aggregations.decay_pct = round(decay_pct, 3) m.y_axis.pressure_kpa.aggregations.hold_start_kpa = round(p0, 2) m.y_axis.gas_temp_c = temp_c m.y_axis.gas_temp_c.aggregations.drift_c = round(drift_c, 2) log.info(f"Hold {HOLD_MIN} min from {p0:.2f} kPa: raw end {p[-n:].mean():.2f} kPa, gas {drift_c:+.2f} C, compensated decay {decay_pct:.3f} %") ppm = [leak.sniff(i) for i in range(1, QD_COUNT + 1)] s = measurements.qd_sniff s.x_axis = list(range(1, QD_COUNT + 1)) s.y_axis.h2_ppm = ppm s.y_axis.h2_ppm.aggregations.max_ppm = round(max(ppm), 2) leak.vent() log.info(f"Sniffer on {QD_COUNT} QDs: max {max(ppm):.2f} ppm at QD {ppm.index(max(ppm)) + 1}, loop vented")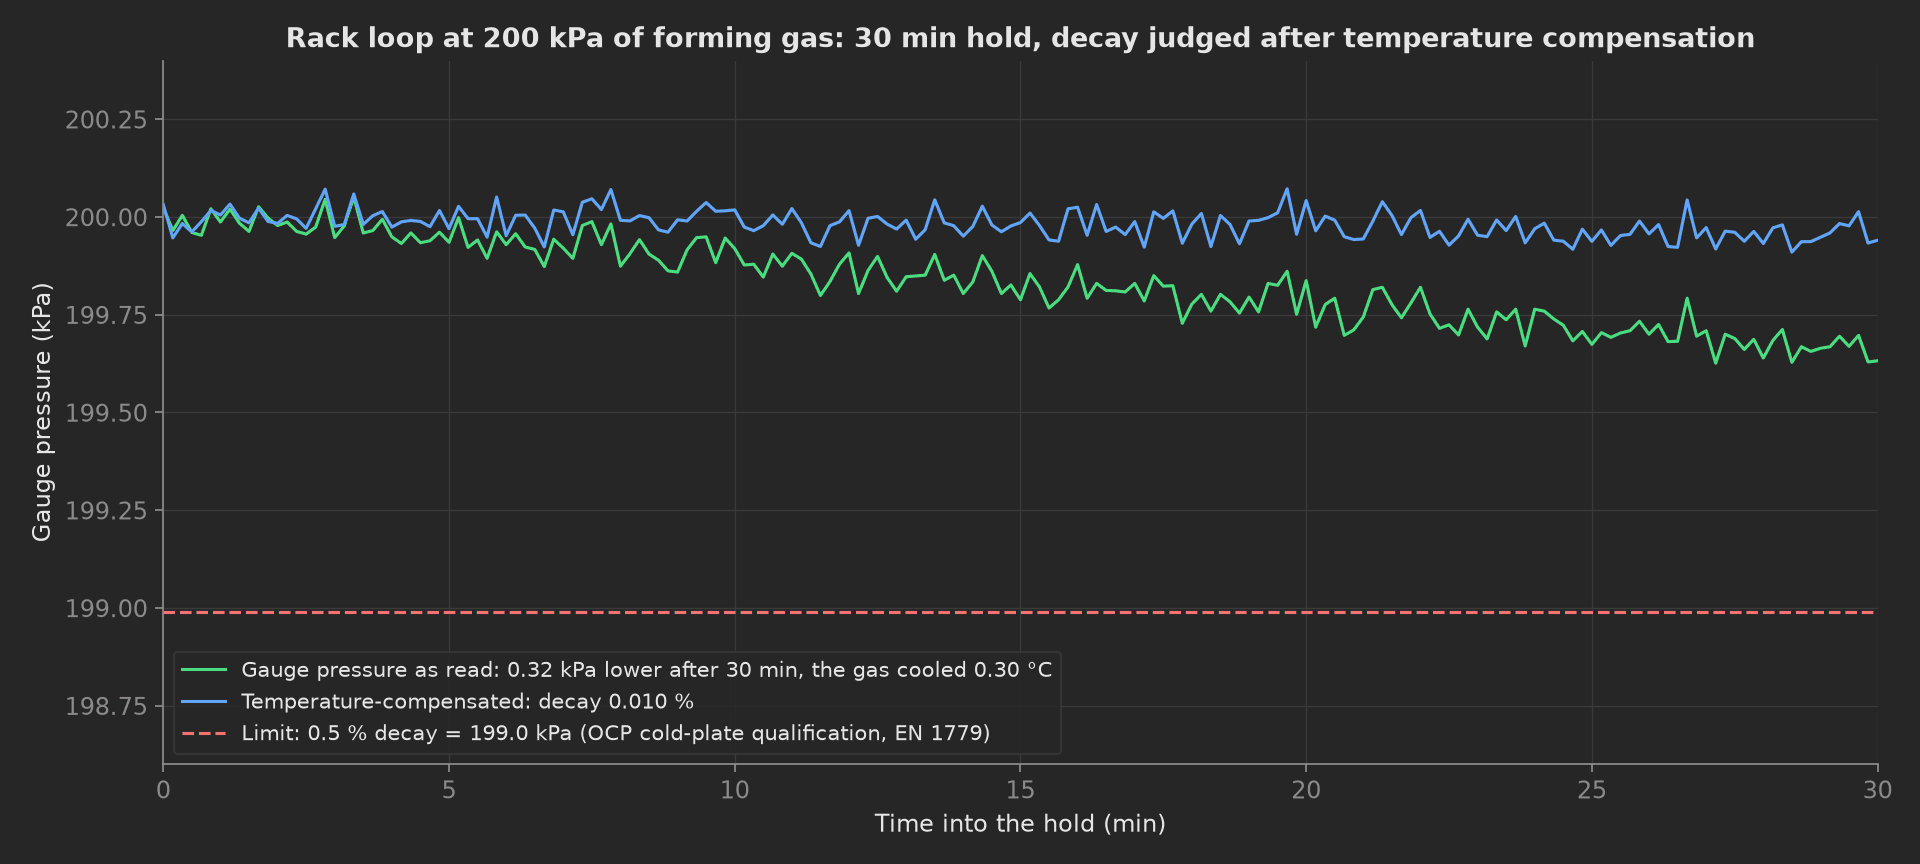
The mock loop over the hold: the raw reading loses 0.32 kPa as the shop cools the gas 0.3 °C, which an uncompensated test would report as 0.16 % decay; corrected to the start temperature the loop shows 0.010 %, which is the transducer's noise. The sniffer reads under 0.5 ppm at fifteen quick-disconnects and 1.8 ppm at QD 11, node 6's return, under the 5 ppm limit and worth a look at the next rack from the same manifold lot.
Fill and Flow
Coolant goes in only after the loop held. The CDU fills from its reservoir with the bleed open and reports the litres taken, which is the first check: a fill 10 % short of the design volume is a node whose quick-disconnects did not open. Then the supply goes to 40 °C, and the phase records the flow and inlet temperature at each node's branch as a multi-dimensional measurement judged on its minimum and its extremes, and the rack's total flow, pressure drop and supply temperature against the CDU boundary.
phases/fill_and_flow.py28 lines
from utils.recipe import COOLANT, NODES, NODE_FLOW_MIN_LPM, NODE_LIQUID_KW, SUPPLY_Cdef fill_and_flow(measurements, cdu, log): """Fill with PG25 from the CDU reservoir, supply to 40 C, then the flow the manifold delivers to each node against the 1.25 LPM/kW floor, with the rack's total flow and pressure drop inside the CDU boundary.""" litres = cdu.fill(COOLANT) cdu.set_supply_c(SUPPLY_C) flows = cdu.node_flow_lpm() inlets = cdu.node_inlet_c() rack_flow = cdu.rack_flow_lpm() dp = cdu.rack_dp_psi() supply = cdu.supply_c() measurements.fill_volume_l = litres m = measurements.node_flow m.x_axis = list(range(1, NODES + 1)) m.y_axis.flow_lpm = flows m.y_axis.flow_lpm.aggregations.min_lpm = round(min(flows), 2) m.y_axis.flow_lpm.aggregations.min_lpm_per_kw = round(min(flows) / NODE_LIQUID_KW, 3) m.y_axis.inlet_c = inlets m.y_axis.inlet_c.aggregations.max_c = round(max(inlets), 2) m.y_axis.inlet_c.aggregations.min_c = round(min(inlets), 2) measurements.rack_flow_lpm = rack_flow measurements.rack_dp_psi = dp measurements.supply_c = supply log.info(f"{litres:.1f} L of {COOLANT} in; supply {supply:.2f} C, rack {rack_flow:.1f} LPM at {dp:.2f} psi; node flow {min(flows):.2f} to {max(flows):.2f} LPM against a {NODE_FLOW_MIN_LPM:.2f} LPM floor, lowest on node {flows.index(min(flows)) + 1}")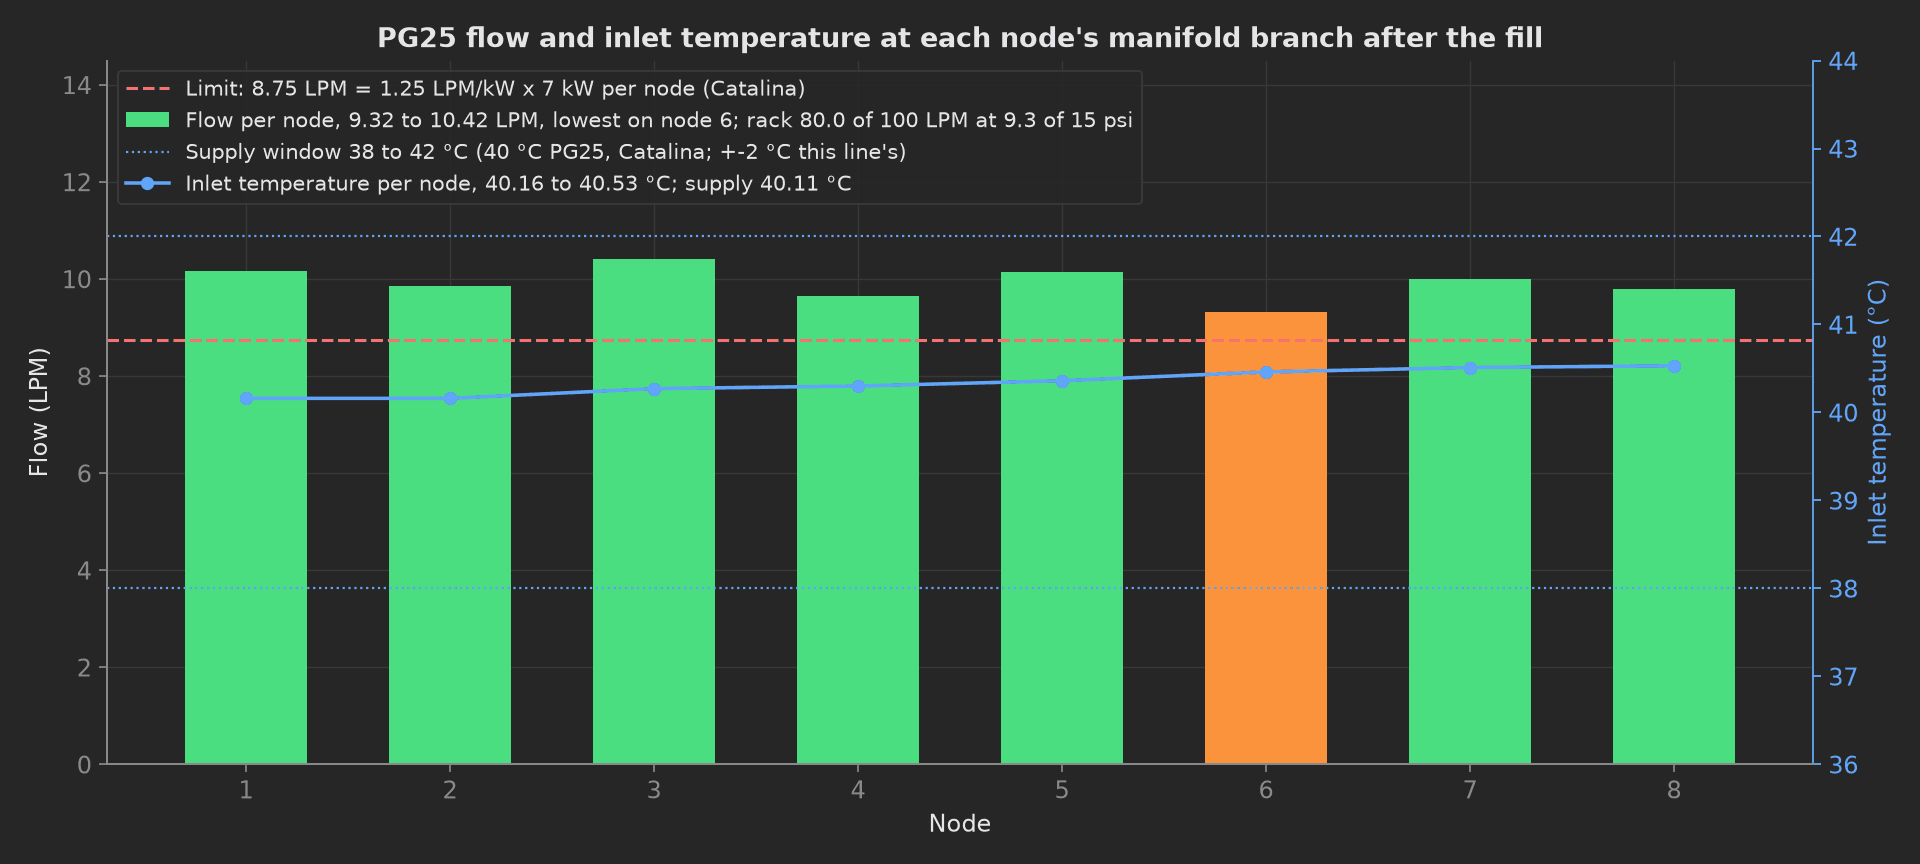
The eight branches of the mock rack: node 6, at the end of the longest hose run on this elevation, gets 9.32 LPM, 6.5 % above the floor; the rack draws 80 LPM of its 100 and drops 9.3 psi of its 15. The floor is 1.25 LPM per kW of heat to liquid, so the number depends on what each node puts into the coolant at its power limit, not on its nameplate.
Power-On and Inventory
With coolant flowing, the nodes power on over Redfish and the phase waits for their agents. Every node's BIOS, BMC, VBIOS and NIC firmware and its GPU and DIMM counts are read, then collapsed into one object: a field with one value across the rack keeps it, a field with several becomes the sorted list of what was seen, and the == against the golden configuration fails on that key with the list in the report. The shelf's idle power closes the phase.
phases/power_on_inventory.py29 lines
from utils.recipe import NODESdef collapse(inventories): """One object for the rack: a field whose value is the same on every node keeps that value; a field that differs becomes the sorted list of what was seen, so the == against the golden set fails on that key.""" out = {} for key in inventories[0]: seen = sorted({str(inv[key]) for inv in inventories}) out[key] = inventories[0][key] if len(seen) == 1 else seen return outdef power_on_inventory(measurements, rack, log): """Nodes powered on over Redfish with the coolant flowing, all eight reachable, inventory of every node collapsed into one object against the golden configuration, and the shelf's idle power.""" reachable = rack.power_on_nodes() inventories = [rack.node_inventory(i) for i in range(NODES)] rack_inventory = collapse(inventories) gpus = sum(inv["gpus"] for inv in inventories) idle_kw = rack.shelf_power_kw() measurements.nodes_reachable = reachable measurements.rack_inventory = rack_inventory measurements.gpus_seen = gpus measurements.idle_power_kw = idle_kw log.info(f"{reachable}/{NODES} nodes up, {gpus} GPUs, BIOS {rack_inventory['bios']} BMC {rack_inventory['bmc']} VBIOS {rack_inventory['vbios']}, shelf {idle_kw:.2f} kW at idle")Network at Rate
Every mapped port loaded to line rate in both directions for 5 min, with the counters cleared before and read after. The phase records four curves indexed by port: line rate achieved, judged on its minimum; FEC corrected codewords, judged on the highest port; FEC uncorrected codewords and PCS symbol errors, judged on their totals, which must be zero. Frames lost across every pair is a fifth number.
phases/network_at_rate.py24 lines
from utils.recipe import PORTS, RATE_TEST_MINdef network_at_rate(measurements, fabric, log): """Every mapped port at line rate in both directions for 5 min (time-scaled in the mock). Corrected FEC codewords are recorded per port and capped; uncorrected codewords, PCS symbol errors and lost frames must total zero.""" log.info(f"{PORTS} ports at rate for {RATE_TEST_MIN} min (mock: instant)") r = fabric.run_at_rate(RATE_TEST_MIN) corrected = r["fec_corrected"] m = measurements.port_counters m.x_axis = list(range(1, PORTS + 1)) m.y_axis.line_rate_pct = r["line_rate_pct"] m.y_axis.line_rate_pct.aggregations.min_pct = round(min(r["line_rate_pct"]), 2) m.y_axis.fec_corrected = corrected m.y_axis.fec_corrected.aggregations.max_per_port = max(corrected) m.y_axis.fec_uncorrected = r["fec_uncorrected"] m.y_axis.fec_uncorrected.aggregations.total = sum(r["fec_uncorrected"]) m.y_axis.symbol_errors = r["symbol_errors"] m.y_axis.symbol_errors.aggregations.total = sum(r["symbol_errors"]) measurements.frames_lost = r["frames_lost"] log.info(f"Line rate {min(r['line_rate_pct']):.2f} % worst; corrected codewords {min(corrected)} to {max(corrected)} (port {corrected.index(max(corrected)) + 1} highest); uncorrected {sum(r['fec_uncorrected'])}, symbol errors {sum(r['symbol_errors'])}, frames lost {r['frames_lost']}")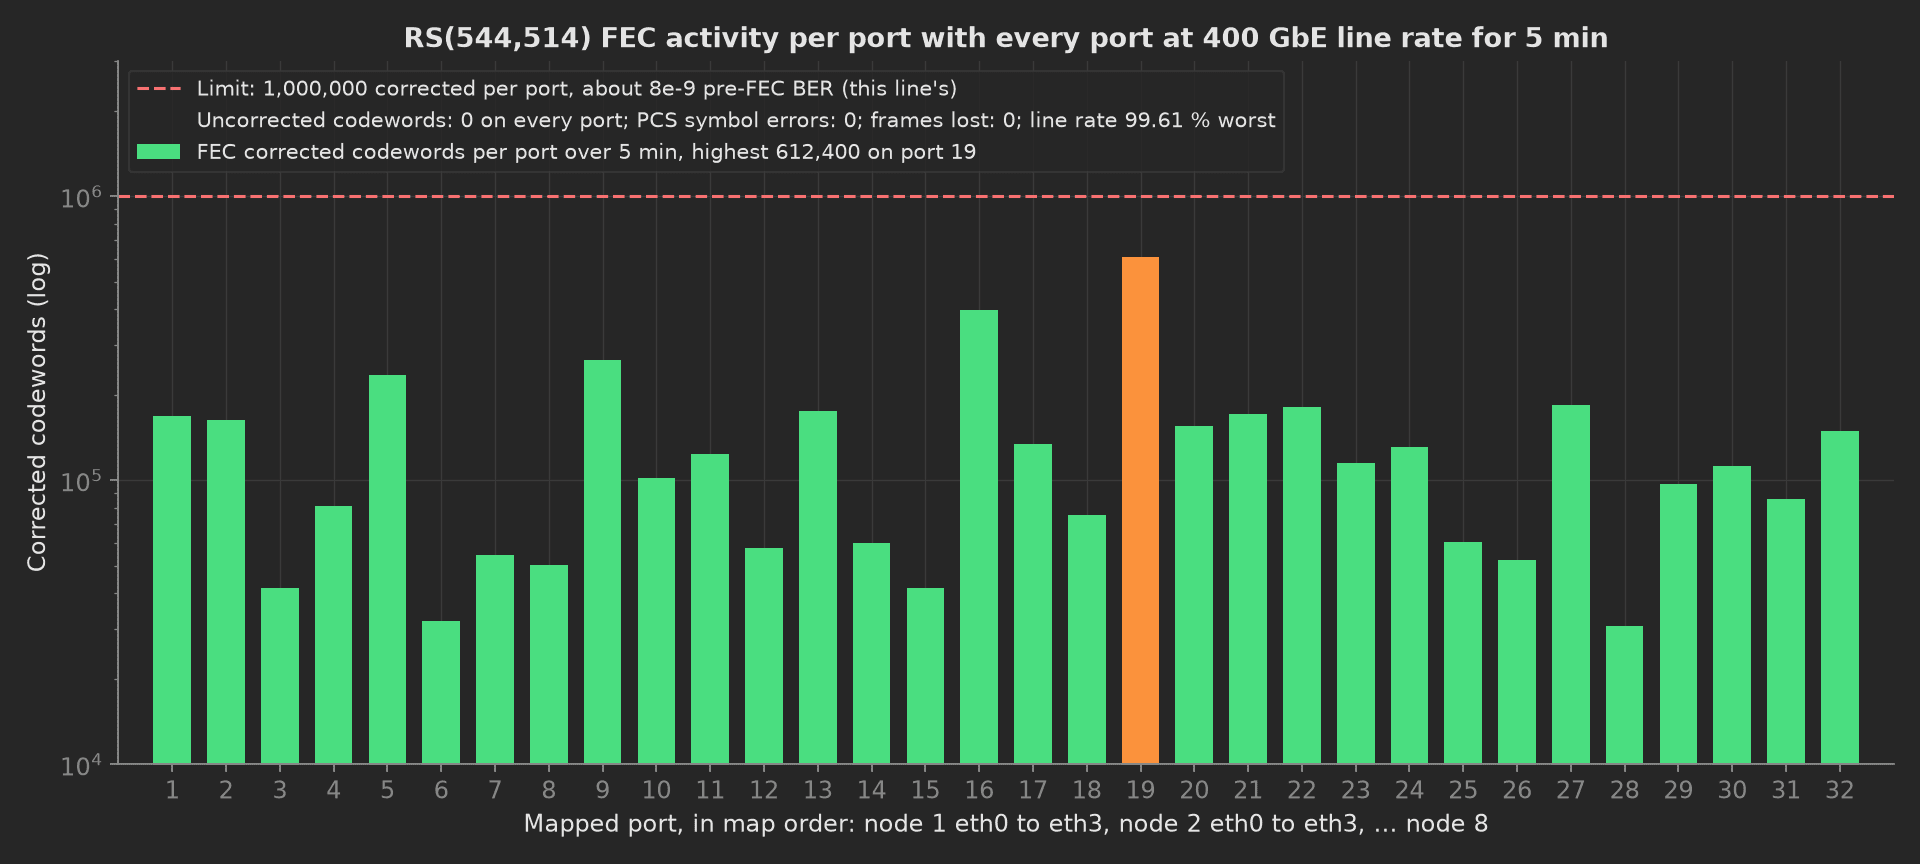
Symbol errors on a healthy 400 GbE link are all zero, so the chart shows what is not: the corrected-codeword count per port, which spans a decade across the rack and peaks on mapped port 19, node 5's eth2 on ToR 2. That port passes; it is the endface to inspect if the count grows at the next run. The corrected ceiling of a million in 5 min corresponds to a pre-FEC bit-error rate around 8e-9, four decades under the 2.4e-4 the code is specified to correct, so a port that reaches it has a problem long before it drops a frame.
NCCL Cluster
nvidia-smi nvlink -s on all 64 GPUs first, then all_reduce_perf across the 64 ranks over the fabric with a message-size sweep from 1 MiB to 8 GiB. The phase records bus and algorithm bandwidth per size and judges the peak against 90 % of the node NIC ceiling.
phases/nccl_cluster.py21 lines
from utils.recipe import BUSBW_MIN_PCT, MSG_SIZES_B, NODE_NIC_GBS, RANKSdef nccl_cluster(measurements, rack, log): """NVLink status on every GPU, then all_reduce_perf across the 64 ranks over the fabric with a message-size sweep. Bus bandwidth at the largest message is judged against 90 % of the node NIC ceiling: an inter-node ring cannot move more than the node's NICs carry.""" links_down = rack.nvlink_links_down() bus, alg = rack.nccl_all_reduce(MSG_SIZES_B) peak = max(bus) pct = 100.0 * peak / NODE_NIC_GBS measurements.nvlink_links_down = links_down m = measurements.all_reduce m.x_axis = [s / 2**20 for s in MSG_SIZES_B] m.y_axis.busbw_gbs = bus m.y_axis.busbw_gbs.aggregations.peak_gbs = round(peak, 2) m.y_axis.busbw_gbs.aggregations.pct_of_ceiling = round(pct, 2) m.y_axis.algbw_gbs = alg log.info(f"{RANKS} ranks, {links_down} NVLinks down; busbw {bus[0]:.1f} GB/s at 1 MiB to {peak:.1f} GB/s at 8 GiB, {pct:.1f} % of the {NODE_NIC_GBS:.0f} GB/s ceiling (floor {BUSBW_MIN_PCT:.0f} %)")The mock rack reaches 187.4 GB/s at 8 GiB, 93.7 % of the 200 GB/s its four 400 GbE NICs per node can carry. A rack with one NIC on a slow lane, or a ring that NCCL had to route through fewer NICs because of the cable map, plateaus lower and fails here after passing every port test individually.
Soak
Twenty-four hours at the power limit on every node under DCGM diagnostics, instant in the mock. The phase records per node the hottest GPU, throttle events and ECC counters as one multi-dimensional measurement judged on the maximum temperature and the totals, and reads the leak sensors under the manifold and the shelf's fault log.
phases/soak.py23 lines
from utils.recipe import GPU_TEMP_MAX_C, NODES, SOAK_Hdef soak(measurements, rack, cdu, log): """24 h at the power limit on every node (time-scaled in the mock): the hottest GPU per node, throttle events, ECC counters, the leak sensors under the manifold and the shelf's fault log. Nothing may grow.""" log.info(f"Soak {SOAK_H} h at the power limit on {NODES} nodes (mock: instant)") r = rack.soak(SOAK_H) temps = r["max_gpu_temp_c"] m = measurements.node_soak m.x_axis = list(range(1, NODES + 1)) m.y_axis.max_gpu_temp_c = temps m.y_axis.max_gpu_temp_c.aggregations.max_c = round(max(temps), 1) m.y_axis.throttle_events = r["throttle_events"] m.y_axis.throttle_events.aggregations.total = sum(r["throttle_events"]) m.y_axis.ecc_uncorrectable = r["ecc_uncorrectable"] m.y_axis.ecc_uncorrectable.aggregations.total = sum(r["ecc_uncorrectable"]) m.y_axis.ecc_corrected = r["ecc_corrected"] measurements.leak_sensor_events = cdu.leak_events() measurements.psu_faults = rack.psu_faults() log.info(f"Hottest GPU {max(temps):.1f} C on node {temps.index(max(temps)) + 1} (limit {GPU_TEMP_MAX_C:.0f} C), {sum(r['throttle_events'])} throttle events, {sum(r['ecc_uncorrectable'])} uncorrectable ECC, {sum(r['ecc_corrected'])} corrected, {cdu.leak_events()} leak events, {rack.psu_faults()} PSU faults")The hottest GPU on the mock rack is on node 6 at 78.7 °C, the node with the least flow, which is the correlation the two measurements exist to show. Corrected ECC is recorded without a limit; uncorrectable ECC, throttling, leaks and PSU faults must be zero.
Ship Prep
The teardown reads the loop's volume from the CDU and classifies it wet, drained or partial, puts the CDU into ship mode, reads the shelf blackbox as one object and the BMC event logs for critical entries, and writes the final cable map, LLDP table and diff to a file that it attaches to the run. The operator's ship-state declaration and the capped-QDs confirmation arrive through the phase's UI, bound to their measurements.
phases/ship_prep.py31 lines
import jsonimport tempfilefrom pathlib import Pathfrom utils.recipe import LOOP_VOLUME_Lfrom utils.topology import EXPECTED_LINKS, diffdef ship_prep(measurements, rack, cdu, fabric, attach, unit, log): """Teardown: the loop's state as the CDU sees it next to the state the operator declared, the CDU into ship mode, the shelf blackbox and the BMC event logs empty, and the final cable map attached as a report.""" litres = cdu.loop_volume_l() if litres >= 0.9 * LOOP_VOLUME_L: loop_state = "wet" elif litres <= 0.05 * LOOP_VOLUME_L: loop_state = "drained" else: loop_state = "partial" cdu.ship_mode() measurements.loop_state = loop_state measurements.coolant_in_loop_l = litres measurements.shelf_blackbox = rack.shelf_blackbox() measurements.sel_critical = rack.sel_critical() seen = fabric.lldp_table() report = {"rack": unit.serial_number, "map": EXPECTED_LINKS, "lldp": seen, "diff": diff(seen)} path = Path(tempfile.gettempdir()) / f"topology-diff-{unit.serial_number}.json" path.write_text(json.dumps(report, indent=2)) attach.file(str(path), "topology-diff.json") log.info(f"Loop {loop_state} with {litres:.1f} L, CDU in ship mode, blackbox and SEL clean, cable map attached")The headless run answers the UI from ui.json:
{ "ship_prep": { "ship_state": "wet", "qds_capped": true }}Mock Plugs
Four plugs, one per link, because each is a different connection on a real line and plugs run in separate processes. Every method returns plain Python types because plug calls cross a JSON boundary; a measurement read back from measurements.<key> returns a proxy, so the phases keep locals for their log lines.
RackManager stands in for the rack manager, the eight BMCs, the shelf and the node agents: it returns the build record and the golden inventory, reports 10.6 kW at idle, models the all-reduce as an 85 µs latency floor plus the bytes each rank moves over its share of the node's NICs at 93.5 % of their rate, and returns a soak whose hottest GPU is on node 6, 78.3 °C before noise.
plugs/rack_manager.py90 lines
"""Rack manager, node BMCs and the node agents (mock): asset labels and FRUs,Redfish power and inventory, the power shelf over its Modbus port, and anagent on every node that runs nvidia-smi, nvbandwidth, NCCL tests and DCGM.Maps to the rack manager's API for the shelf and the leak GPIOs, Redfish onthe eight BMCs for power, FRU, SEL and sensors, and an SSH agent on every nodefor the GPU tooling. The mock synthesizes a rack built to its record: everynode at the golden configuration, all NVLinks up, ring all-reduce reaching93 % of the node NIC ceiling at 8 GiB, and 24 h of soak with the hottest GPUat 78 C, no throttling, no uncorrectable ECC and a silent shelf."""import numpy as npfrom utils.recipe import BUILD_RECORD, GOLDEN_CONFIG, NODES, NODE_NIC_GBS, RANKSclass RackManager: T0_S = 85e-6 # all-reduce latency floor across 64 ranks BUSBW_FRACTION = 0.935 # of the node NIC ceiling, once the message is large def __init__(self, address): self.address = address self._rng = np.random.default_rng(1400) self._powered = False # self.redfish = [redfish.redfish_client(bmc) for bmc in ...]; self.shelf = ModbusTcpClient(address) print(f"Rack manager at {address}: 8 BMCs enumerated, shelf on the bus") def read_build_labels(self): """Rack asset tag and elevation revision from the rack manager, node serials from the BMC FRUs, switch serials from their management API, PSU serials from the shelf's Modbus registers.""" return {k: (list(v) if isinstance(v, list) else v) for k, v in BUILD_RECORD.items()} def power_on_nodes(self): """Power every node on over Redfish and wait for the OS agents. Nodes reachable.""" self._powered = True return NODES def node_inventory(self, index): """BIOS, BMC, VBIOS and NIC firmware, GPU and DIMM counts from Redfish and the agent.""" return dict(GOLDEN_CONFIG) def shelf_power_kw(self): return round(10.6 + self._rng.normal(0.0, 0.1), 2) def nvlink_links_down(self): """nvidia-smi nvlink -s on every GPU: links reported inactive.""" return 0 def nccl_all_reduce(self, sizes_b): """all_reduce_perf across the 64 ranks over the fabric, one row per message size. Ring time is a latency floor plus the bytes each rank moves over its share of the node's NICs.""" factor = 2.0 * (RANKS - 1) / RANKS bus = [] alg = [] for s in sizes_b: t = self.T0_S + factor * s / (self.BUSBW_FRACTION * NODE_NIC_GBS * 1e9) t *= 1.0 + self._rng.normal(0.0, 0.004) alg.append(round(s / t / 1e9, 2)) bus.append(round(factor * s / t / 1e9, 2)) return bus, alg def soak(self, hours): """DCGM diagnostics at the power limit on every node for the stated time (mock: instant): the hottest GPU temperature per node, clock throttle events, ECC counters.""" max_c = [76.4, 74.9, 77.8, 75.2, 76.1, 78.3, 75.7, 76.9] return { "max_gpu_temp_c": [round(t + self._rng.normal(0.0, 0.2), 1) for t in max_c], "throttle_events": [0] * NODES, "ecc_uncorrectable": [0] * NODES, "ecc_corrected": [0, 1, 0, 0, 2, 0, 0, 1], } def psu_faults(self): """Fault entries across the shelf's modules since power-on.""" return 0 def shelf_blackbox(self): """The six modules' blackbox counters, summed.""" return {"ac_loss": 0, "ovp": 0, "ocp": 0, "otw": 0, "otp": 0, "fan": 0} def sel_critical(self): """System event log entries of severity Critical across the eight BMCs since power-on.""" return 0 def __del__(self): print("Nodes left powered, BMC sessions closed")Fabric returns an LLDP table that matches the map and a run at rate where corrected codewords are log-uniform between 30,000 and 400,000 per port with port 19 at 612,400, and nothing uncorrected.
plugs/fabric.py49 lines
"""The two top-of-rack switches and the nodes' NICs (mock): the LLDPneighbour tables, the port counters, and a line-rate traffic run driven fromthe nodes.Maps to the ToRs' management API (SONiC over gNMI or the vendor's REST) forLLDP and the per-port PCS and FEC counters, and to a traffic agent on everynode (ib_write_bw or iperf3 in a full mesh, or the fabric's own diagnostictraffic) for the run at rate. The mock synthesizes a rack cabled exactly toits map, every port at 400 GbE, and RS(544,514) FEC correcting a healthynumber of codewords with nothing uncorrected: port 19 corrects more than theothers and is the endface to clean next time."""import numpy as npfrom utils.recipe import PORTSfrom utils.topology import EXPECTED_LINKSclass Fabric: def __init__(self, tor1, tor2): self.tors = [tor1, tor2] self._rng = np.random.default_rng(1300) # self.api = [SonicClient(tor1), SonicClient(tor2)]; self.agents = [...] print(f"ToRs at {tor1} and {tor2} reachable, node traffic agents idle") def lldp_table(self): """Neighbour rows from both ToRs: local port, neighbour system name (the node serial) and port id (the NIC), negotiated speed.""" return [{"tor": e["tor"], "port": e["port"], "node": e["node"], "nic": e["nic"], "gbps": e["gbps"]} for e in EXPECTED_LINKS] def run_at_rate(self, minutes): """Every port loaded to line rate in both directions for the stated time (mock: instant); the counters are cleared before and read after. Corrected codewords are log-uniform across the ports; port 19 sits higher; nothing is uncorrected and no PCS symbol error is seen.""" rate = 99.7 + self._rng.normal(0.0, 0.05, PORTS) corrected = np.exp(self._rng.uniform(np.log(3e4), np.log(4e5), PORTS)).astype(int) corrected[18] = 612_400 return { "line_rate_pct": rate.round(2).tolist(), "fec_corrected": corrected.tolist(), "fec_uncorrected": [0] * PORTS, "symbol_errors": [0] * PORTS, "frames_lost": 0, } def __del__(self): print("Traffic agents stopped, ToR sessions closed")LeakBench holds a loop whose pressure follows the gas temperature, with a 0.02 % leak under the transducer's 0.03 kPa of noise, and a sniffer that reads 1.6 ppm at QD 11 and a quarter of that elsewhere.
plugs/leak_bench.py58 lines
"""Gaseous leak bench (mock): the forming-gas panel on the rack manifold'ssupply stub, a gauge-pressure transducer and a gas thermocouple on thereturn stub, and a hydrogen sniffer probe.Maps to a regulated N2/H2 (95/5) panel with a shut-off valve, a 0 to 400 kPatransducer read over Modbus, a type-T thermocouple in the return stub, and anInficon Sensistor Sentrac hydrogen leak detector with its hand probe. Stationscoped: the sniffer's warm-up is longer than a rack's test, so the stationkeeps it open between racks. The mock synthesizes a tight loop: a pressurethat follows the gas temperature, no leak the transducer can resolve, and onequick-disconnect that reads above the others and still well under the limit."""import numpy as npfrom utils.recipe import ATM_KPAclass LeakBench: def __init__(self, gas_panel, sniffer): self.gas_panel = gas_panel self.sniffer = sniffer self._rng = np.random.default_rng(1100) self._p_kpa = 0.0 # self.panel = minimalmodbus.Instrument(gas_panel, 1); self.sniffer = serial.Serial(sniffer, 9600) print(f"Leak bench: gas panel on {gas_panel} closed, sniffer on {sniffer} warm") def pressurise(self, kpa): """Open the panel until the loop reads the target gauge pressure, then shut.""" self._p_kpa = float(kpa) def stabilise(self, minutes): """Wait out the compression heating so the hold starts from a settled gas (mock: instant).""" return minutes def hold_trace(self, minutes, sample_s): """Gauge pressure and gas temperature over the hold. The shop cools 0.3 C over the half hour and the gas follows it; a 0.02 % real leak sits under the transducer's 0.03 kPa of noise.""" n = int(minutes * 60 / sample_s) + 1 t_min = np.arange(n) * sample_s / 60.0 temp_c = 23.4 - 0.3 * t_min / minutes + self._rng.normal(0.0, 0.02, n) p_abs0 = self._p_kpa + ATM_KPA p_abs = p_abs0 * (temp_c + 273.15) / (temp_c[0] + 273.15) * (1.0 - 0.0002 * t_min / minutes) p_kpa = p_abs - ATM_KPA + self._rng.normal(0.0, 0.03, n) return t_min.round(3).tolist(), p_kpa.round(3).tolist(), temp_c.round(3).tolist() def sniff(self, qd_index): """Hydrogen at one quick-disconnect, in ppm above the background the probe was zeroed on. QD 11 (node 6 return) reads higher than the rest.""" base = 1.6 if qd_index == 11 else 0.25 return round(base + abs(self._rng.normal(0.0, 0.08)), 2) def vent(self): self._p_kpa = 0.0 def __del__(self): print("Gas panel closed, loop vented, sniffer left warm")Cdu fills to 1.4 % over the design volume, delivers eight branch flows between 9.3 and 10.4 LPM with node 6 lowest, and holds the supply 0.12 °C over its set-point.
plugs/cdu.py73 lines
"""Rack CDU and manifold instrumentation (mock): the fill pump and the PG25reservoir, the supply temperature control, the CDU's own flow meter anddifferential-pressure transducer, one turbine flow meter and one inletthermistor per node on the manifold, and the leak-rope sensors under themanifold and in every node's drip tray.Maps to an in-rack CDU with a Modbus TCP register map (Vertiv CoolChip,Motivair or the rack vendor's), the manifold's per-branch flow meters on thesame bus, and the leak sensors on the rack manager's GPIO. The mocksynthesizes a loop that fills to its design volume, eight branches within10 % of each other with node 6 a little restricted, a supply within 0.2 C ofits set-point and a rack dP well under the boundary."""import numpy as npfrom utils.recipe import LOOP_VOLUME_L, NODES# Branch flow at the design pump speed, litres per minute, node 1 to 8. Node 6# has the longest hose run on this elevation._BRANCH_LPM = [10.2, 9.9, 10.4, 9.7, 10.1, 9.3, 10.0, 9.8]class Cdu: def __init__(self, address): self.address = address self._rng = np.random.default_rng(1200) self._litres = 0.0 self._supply_c = 0.0 self._pump = False # self.modbus = ModbusTcpClient(address) print(f"CDU at {address}: pump off, reservoir full, loop empty") def fill(self, coolant): """Fill from the reservoir with the air bleed open until the return runs clear, then close the bleed. Litres taken from the reservoir.""" self._litres = round(LOOP_VOLUME_L * 1.014 + self._rng.normal(0.0, 0.2), 1) return self._litres def set_supply_c(self, celsius): self._supply_c = float(celsius) self._pump = True def supply_c(self): return round(self._supply_c + 0.12 + self._rng.normal(0.0, 0.03), 2) def node_flow_lpm(self): return [round(f + self._rng.normal(0.0, 0.05), 2) for f in _BRANCH_LPM] if self._pump else [0.0] * NODES def node_inlet_c(self): """Manifold branch temperature at each node, warmer down the rack as the supply picks up heat from the return manifold beside it.""" return [round(self._supply_c + 0.12 + 0.06 * i + self._rng.normal(0.0, 0.03), 2) for i in range(NODES)] def rack_flow_lpm(self): return round(sum(_BRANCH_LPM) + 0.3 + self._rng.normal(0.0, 0.1), 1) if self._pump else 0.0 def rack_dp_psi(self): return round(9.4 + self._rng.normal(0.0, 0.05), 2) if self._pump else 0.0 def leak_events(self): """Leak-rope and drip-tray events since the fill, from the rack manager.""" return 0 def loop_volume_l(self): return self._litres def ship_mode(self): """Pump off, isolation valves closed on both stubs, coolant left where it is.""" self._pump = False def __del__(self): print("CDU pump off, valves closed")The constants and where each limit comes from live in one file:
utils/recipe.py76 lines
"""Integration recipe for a liquid-cooled AI rack at L11: eight GPU nodes,two top-of-rack switches and one ORV3 power shelf on a 48 V busbar, rackedwith the network and the coolant manifold attached, after every node passedits L10 system test and before the rack ships.Nothing at L11 is a published spec. The level itself is the OCP liquidcooling integration white paper's (L10 boots and passes its witness test,L11 is racked with network and manifold, L12 adds the software environment),and the same paper puts a gaseous leak test of the servers, the manifold andthe CDU before the fill. The 0.5 % pressure-decay figure is the OCP cold platequalification's (EN 1779). The rack's coolant boundary is Meta's Catalinaexample: PG25, 40 C supply, at most 100 LPM and 15 psi at the rack, 1.25 to1.5 LPM per kW. Everything else is this line's practice, and each constantsays so where it is used and again in procedure.yaml."""# The rackNODES = 8NODE_LIQUID_KW = 7.0 # heat to liquid per node at its power limitTORS = 2PORTS_PER_NODE = 4 # 400GbE NICs per node, two on each ToRPORT_GBPS = 400PSU_MODULES = 6 # ORV3 HPR 12 kW modules, N+1 for the rack's 58 kWBUILD_RECORD = { "rack": "RACK-AI8-00217", "elevation_rev": "C", "nodes": ["N8G-26-04117", "N8G-26-04118", "N8G-26-04119", "N8G-26-04120", "N8G-26-04121", "N8G-26-04122", "N8G-26-04123", "N8G-26-04124"], "switches": ["TOR-26-00871", "TOR-26-00872"], "psus": ["ORV3-12K-004217", "ORV3-12K-004218", "ORV3-12K-004221", "ORV3-12K-004224", "ORV3-12K-004230", "ORV3-12K-004231"],}GOLDEN_CONFIG = {"bios": "2.4.1", "bmc": "1.12.0", "vbios": "96.00.89.00.01", "nic_fw": "28.41.1000", "gpus": 8, "dimm_gb": 2048}# Gaseous leak before the fill (OCP integration WP), decay figure from the# OCP cold plate qualification (EN 1779). The hold is time-scaled in the mock.FORMING_GAS = "N2 with 5 % H2"TEST_PRESSURE_KPA = 200.0 # gauge, this loop's maximum operating pressureATM_KPA = 101.3STABILISE_MIN = 10 # compression heating settles before the hold startsHOLD_MIN = 30SAMPLE_S = 10DECAY_LIMIT_PCT = 0.5QD_COUNT = 2 * NODES # one supply and one return quick-disconnect per nodeH2_LIMIT_PPM = 5.0 # this line's: ten times the sniffer's noise floor above background# Fill and flow (Meta Catalina rack boundary)COOLANT = "PG25"SUPPLY_C = 40.0SUPPLY_TOL_C = 2.0RACK_FLOW_MAX_LPM = 100.0RACK_DP_MAX_PSI = 15.0LPM_PER_KW = 1.25NODE_FLOW_MIN_LPM = LPM_PER_KW * NODE_LIQUID_KW # 8.75 LPM per nodeLOOP_VOLUME_L = 42.0 # manifold, hoses and eight nodes of cold plates, from the rack's designFILL_TOL_PCT = 10.0 # a fill far short of the design volume is a node that did not open# Power-on and inventoryIDLE_POWER_KW = (8.0, 14.0) # this line's: eight nodes idling and two switches on this shelf# Network at rate (time-scaled in the mock)PORTS = NODES * PORTS_PER_NODE # 32RATE_TEST_MIN = 5LINE_RATE_MIN_PCT = 99.0FEC_CORRECTED_MAX = 1_000_000 # per port over the 5 min, this line's: about 8e-9 pre-FEC BER on RS(544,514), four decades under the 2.4e-4 budget# NCCL across the rackRANKS = NODES * 8MSG_SIZES_B = [2**k for k in range(20, 34)] # 1 MiB to 8 GiBNODE_NIC_GBS = PORTS_PER_NODE * PORT_GBPS / 8.0 # 200 GB/s: the inter-node ceiling of ring all-reduce bus bandwidthBUSBW_MIN_PCT = 90.0# Soak (time-scaled in the mock)SOAK_H = 24GPU_TEMP_MAX_C = 85.0 # this line's: 5 C under the GPU's slowdown thresholdOn a real line, replace each plug with the class that speaks to the link it mocks: the rack manager's API and Redfish for RackManager, with an SSH agent per node for the GPU tooling; the ToRs' gNMI or REST for Fabric, with a traffic agent per node; Modbus on the gas panel and serial on the sniffer for LeakBench; Modbus TCP on the CDU for Cdu. Keep the temperature compensation in the phase, clear the port counters before the run at rate and read them after, let the hold and the soak run their full time, and remove --ui-values so the operator answers the teardown. The phases, measurements and limits stay the same.