
Get the complete source, dependencies and setup instructions from the template repository.
Open the source on GitHubIntroduction
GPU Baseboard Overview
An AI server in the HGX or OCP OAM form factor carries its eight accelerators on one baseboard: eight GPU modules on a universal baseboard (UBB) joined by NVLink switches, with the PCIe links to the host CPUs, the power sequencing for each module and the thermal interface to the cold plates or the heatsinks all on that one board. The baseboard reaches the integrator as an assembled part and is built into a node through the L6 to L9 levels; at L10 the node boots an operating system and is tested as a system for the first time. That is where a module with a marginal HBM stack, an NVLink lane that trains at reduced width, a cold plate that is not seated, or a PCIe slot that enumerates at gen4 is found, before the node is racked at L11 and cabled into a cluster whose all-reduce runs at the speed of its slowest link.
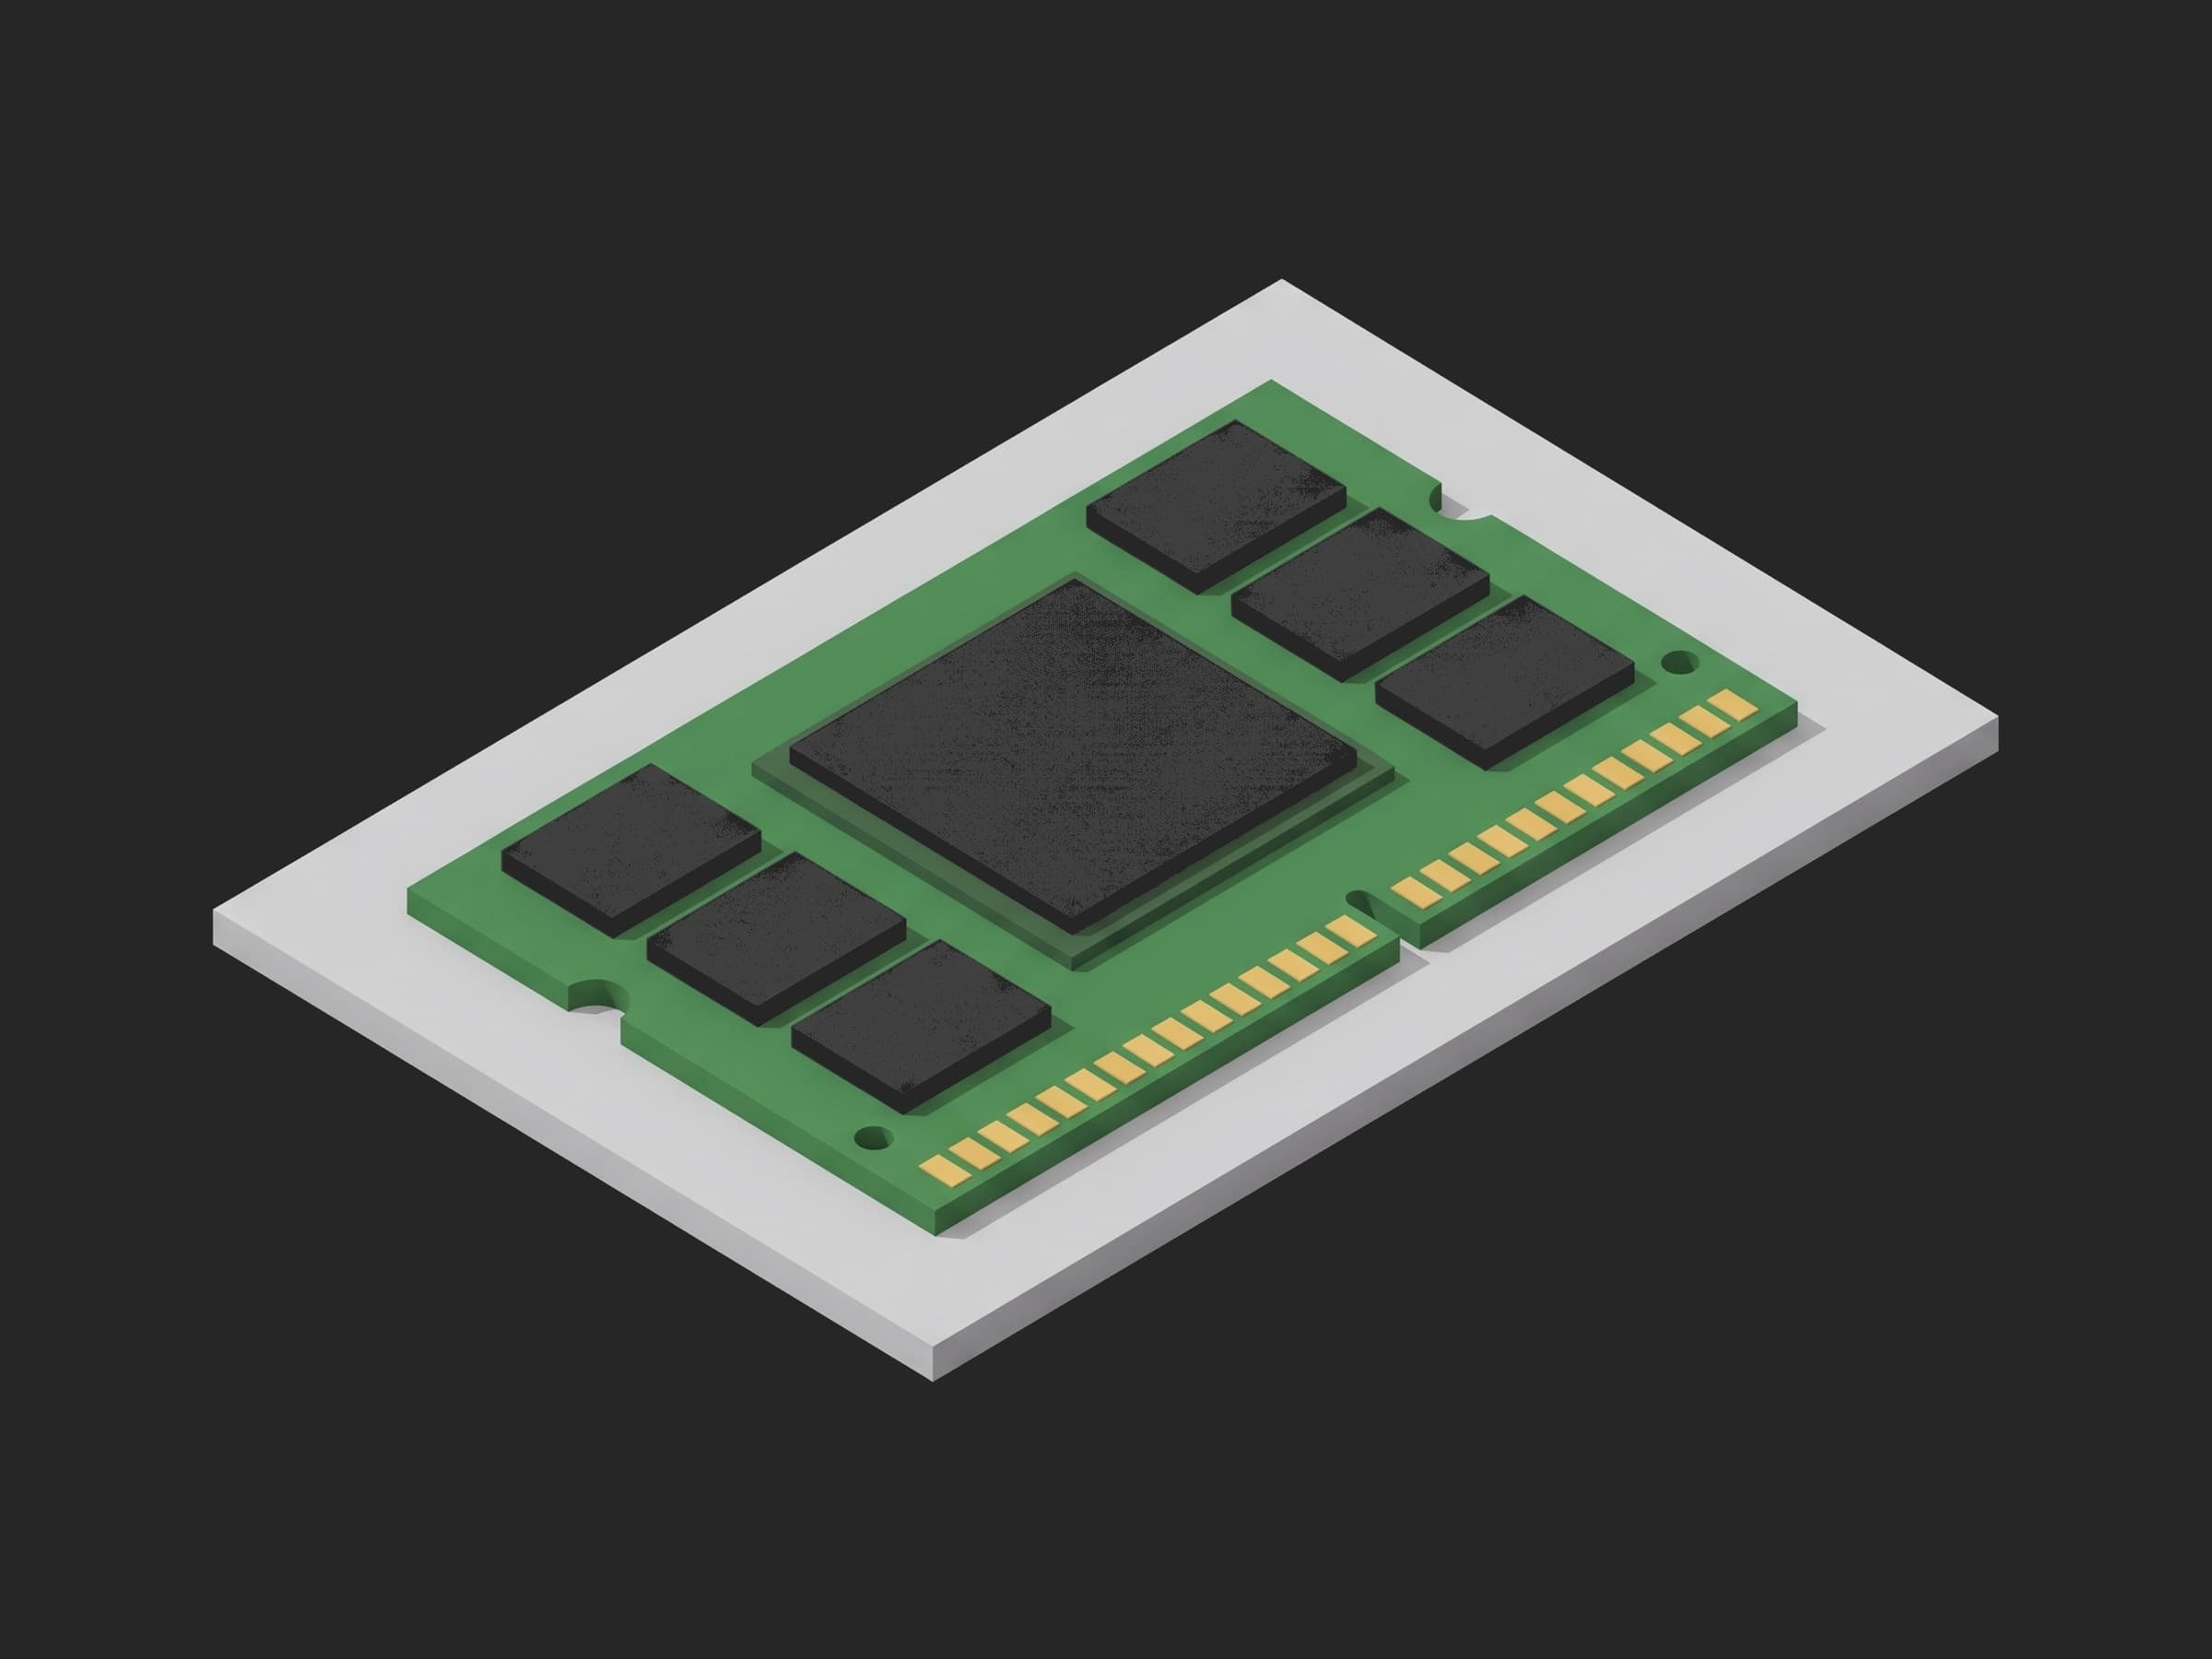
The parts this test exercises: each module's HBM stacks and the ECC and row-remapping logic in front of them, the PCIe link to the host, the NVLink links between modules, the voltage regulators that must hold TDP for as long as the workload asks, and the thermal path from the die to the coolant.
The test flow is NVIDIA's Data Center GPU Manager diagnostics, a ladder of four levels invoked as dcgmi diag -r <level>: level 1 is software only (driver, NVML, CUDA libraries, persistence mode, denylist) and runs in seconds; level 2 adds PCIe and NVLink, a memory allocation test and a memory bandwidth test; level 3 adds the diagnostic matrix, targeted stress, targeted power that drives each GPU to a power target, nvbandwidth, nccl_tests and a short EUD; level 4 adds the HBM memtest patterns, the pulse test that exercises the voltage regulators, and the full EUD, at about two hours for eight GPUs. DCGM's example configuration for an H100 PCIe card sets a target_power of 350 W, a memory bandwidth minimum of 1,230,000 MB/s and a PCIe link of at least gen3 x16; those are the only numbers NVIDIA publishes as limits, and they are for a different module than the SXM-class board here. The OCP UBB r2.0 base specification defines the power sequencing signals of the baseboard (PWREN, PWROK, PWRBRK#, THERMTRIP#) but no test flow. The acceptance rules that integrators apply on top, zero uncorrectable ECC, a ceiling on correctable ECC and on row-remap events during the soak, and a soak of 24 to 72 hours at elevated intake temperature, are practice, not a standard. Every limit in this template is DCGM's example, the board's golden configuration, or this line's derivation, and the procedure file says which.
Test Purpose
The procedure records one diagnostic fingerprint per baseboard:
- DCGM level 1 as an executable phase whose exit code is the result, nothing to parse
- Inventory: eight GPUs enumerated, PCIe generation and width per GPU, the firmware set as one object, NVLink links up per GPU, the baseboard serial against the label, and the ECC counters as a baseline
- DCGM level 2 as an executable phase, then memory bandwidth and PCIe bandwidth per GPU parsed from its report and judged against this line's floors
- DCGM level 3 with targeted_power for 300 s, then power reached per GPU as a percentage of TDP, the hottest sensor, the throttle count and the duration DCGM reports
- nccl_tests all_reduce_perf across the eight GPUs, the bus bandwidth curve from 8 B to 8 GiB judged at the top of the sweep against the line's reference
- DCGM level 4 memtest, then the ECC and row-remap counters minus the inventory baseline
- A 24 hour soak at 35 °C intake sampled hourly, the hottest GPU and the board power over time, per GPU the maximum temperature and the minimum SM clock, the ECC counters minus the memtest phase's, and zero XID in the kernel log
- A teardown that attaches the four DCGM reports and the NCCL log, stamps the eight GPU serials on the unit, and clears the volatile counters
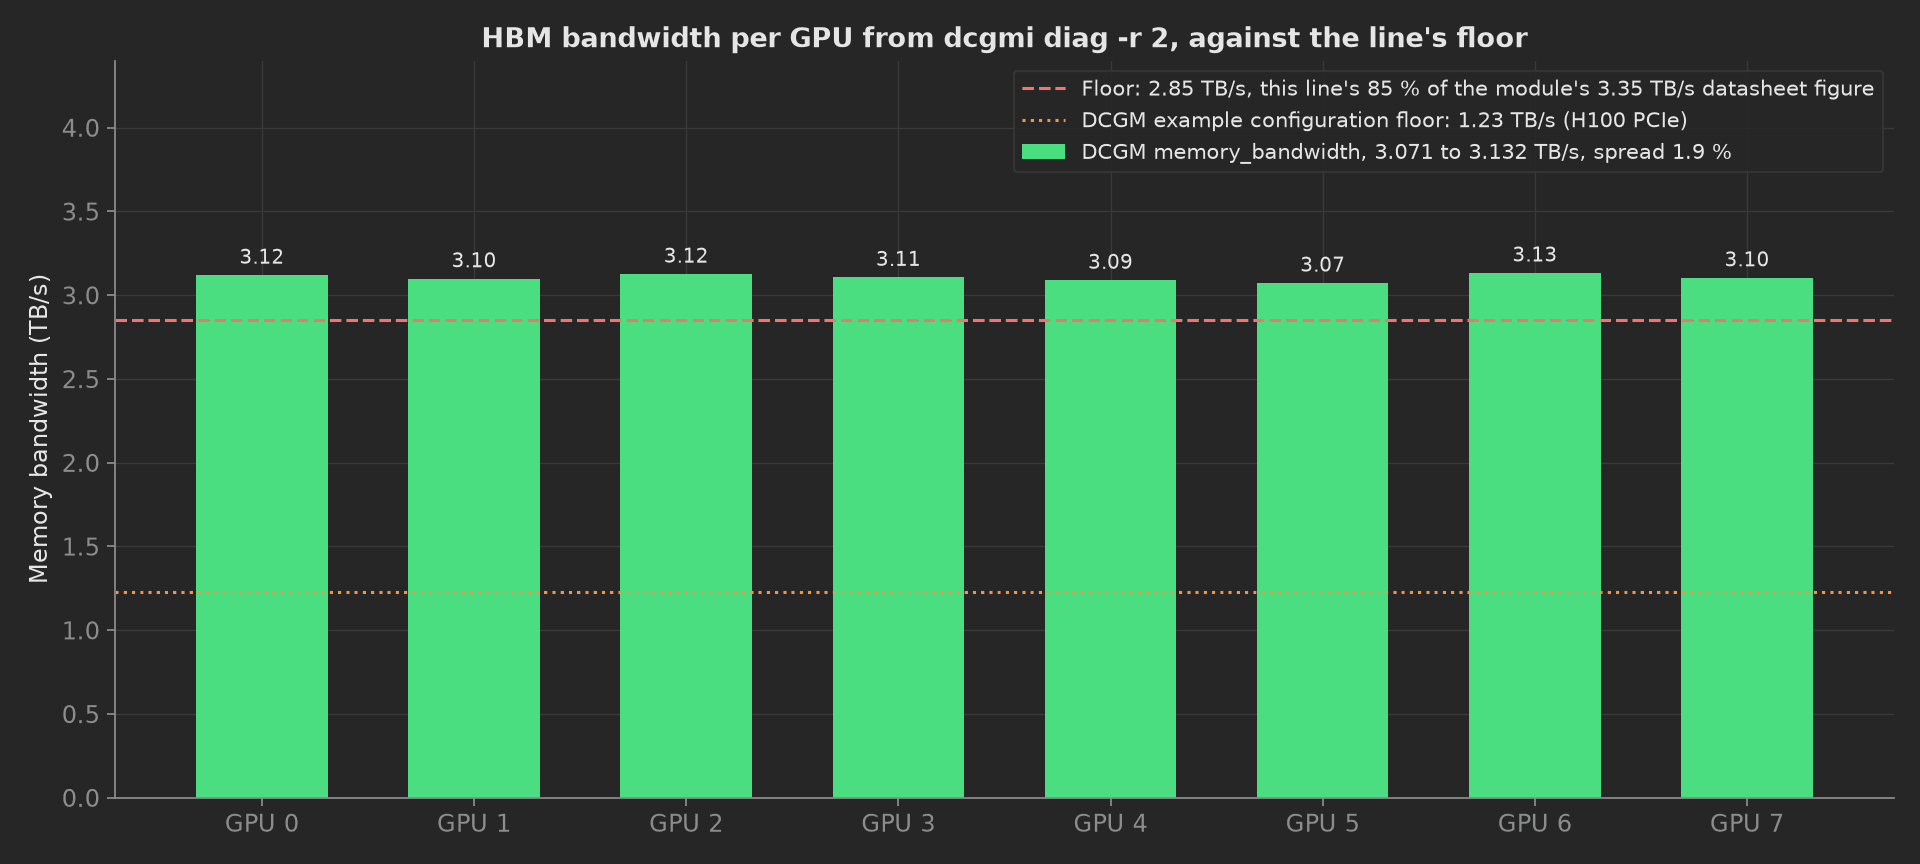
The mock board's level 2 result: eight modules between 3.07 and 3.13 TB/s, a 1.9 % spread, against the floor this line derives from the module's datasheet figure. The DCGM example floor for a PCIe card is drawn for scale; a board that passes it can still be a board with one module 20 % under its siblings.
The framework mechanics on show are executable phases judged on their exit code, one per DCGM level and one for nccl_tests, each chained through depends_on to a Python phase that parses the report the command wrote; previous-results injection, with the memtest phase receiving the inventory phase's ECC baseline and the soak receiving the memtest's counters; per-GPU multi-dimensional measurements with custom aggregations validated in the YAML; attach.file for the raw reports, unit.metadata for the GPU serials and run.metadata for the DCGM version and the soak length; and a timeout sized per level.
Equipment & Setup
To run this ladder on an L10 line, the following are required:
- The node under test, the baseboard built into its chassis with CPUs, memory, NICs and cooling, booting the line's OS image with the driver, DCGM and nccl_tests installed
- A test rack position with the intake temperature controlled at 35 °C for the soak, and a metered rack PDU to log the node's power
- A station computer with SSH to the node and a route to the BMC, running the TofuPilot Framework station
- The BMC on the management network, for the baseboard serial, the intake temperature and the power state over Redfish
- The Device Under Test (DUT): the 8-GPU baseboard, identified by the serial the BMC reports under the chassis
- A TofuPilot Framework procedure to run the levels in order and validate the limits
- The TofuPilot Dashboard to keep the per-board evidence, the raw DCGM reports and the ECC history of every module
Hardware Components
Diagnostics on the Node
NVIDIA DCGM ships dcgmi, whose diag command runs the four levels and writes a JSON report with -j; the test names in the report (PCIe, Memory Bandwidth, Targeted Power, Memtest) are the plugin names the parsers here key on, and -p targeted_power.test_duration=300 sets the line's stress duration. nccl_tests provides all_reduce_perf, which prints one line per message size with the algorithm and bus bandwidth and the count of wrong values when validation is on. Both are invoked exactly as written, over SSH from the station or from a station process on the node itself, and redirected to a file under results/ that the next phase reads.
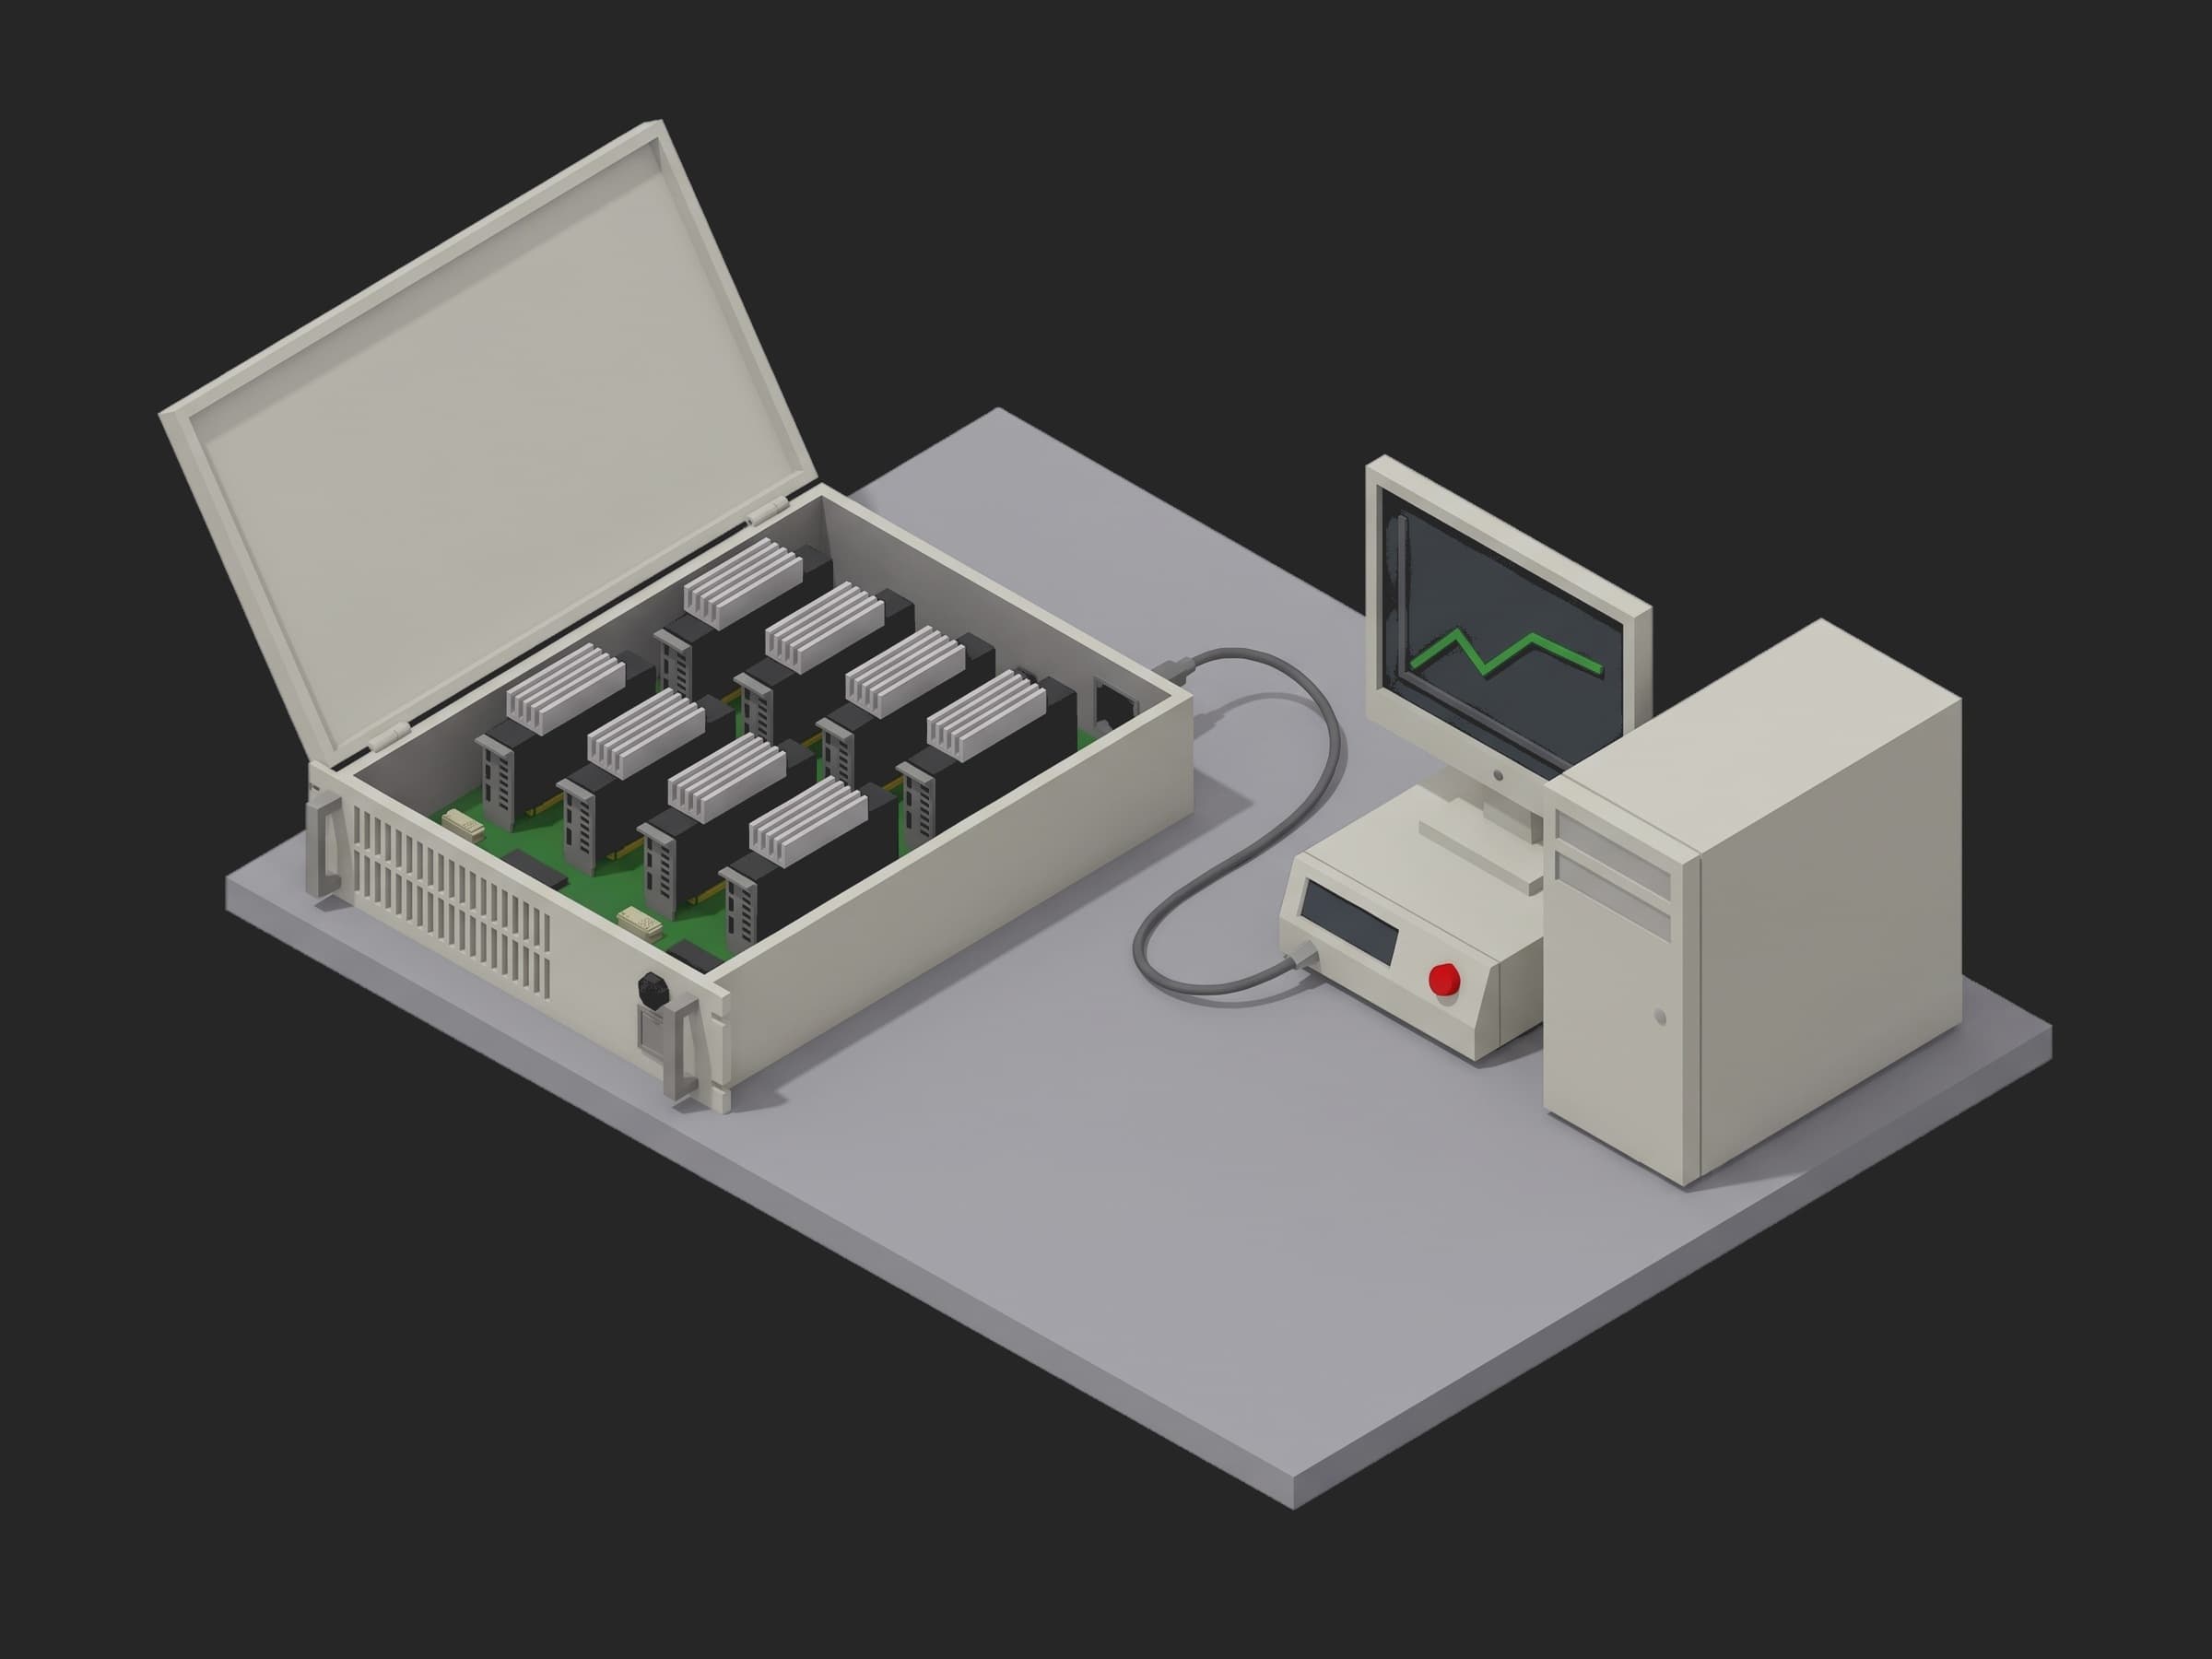
An L10 position: the node open on the bench for the first levels, the station computer beside it. The soak runs with the chassis closed in the rack position.
Node Agent
Between the diagnostic runs the station reads the node: nvidia-smi -q -x for the inventory, the PCIe link state, the VBIOS and the ECC and row-remapper counters, nvidia-smi nvlink -s for the links up per GPU, the BMC's Redfish API for the baseboard serial and the intake sensor, and journalctl -k for XID events. The DCGM Python bindings can replace the nvidia-smi calls on a line that prefers a library to a parsed command.
Where the Limits Come From
| Test | Limit | Basis |
|---|---|---|
| GPU count, PCIe link | 8 GPUs, gen5 x16 on every module | the board's golden configuration; DCGM's example asks for gen3 x16 at least |
| Firmware | driver, VBIOS, DCGM as one object, exact | the release; no tolerance applies |
| NVLink | 18 links up per GPU | the board's topology |
| Memory bandwidth | ≥ 2,850,000 MB/s per GPU, spread ≤ 5 % | this line's derivation: 85 % of the module's 3.35 TB/s datasheet figure; DCGM's example floor is 1,230,000 MB/s for an H100 PCIe card |
| PCIe bandwidth | ≥ 45 GB/s host to device | this line's, from the golden node's first article |
| Targeted power | ≥ 95 % of the 700 W power limit, 0 throttle events, 300 s | DCGM's test; the power limit is what nvidia-smi reports for the module; 95 % and 300 s are this line's |
| Temperature | ≤ 85 °C at the hottest sensor, stress and soak | this line's ceiling |
| NCCL all_reduce | bus bandwidth ≥ 432 GB/s at the top of the sweep | 90 % of this line's 480 GB/s reference, the median of its golden nodes; the 90 % rule is integrator practice |
| Memtest | 0 errors per GPU | DCGM's test |
| ECC | uncorrectable 0, rows pending remap 0, correctable ≤ 10 per GPU per stage | integrator practice for the rule; the 10 is this line's |
| SM clock | ≥ 1500 MHz sustained under the soak load | this line's, from the golden node |
| Soak | 24 h at 35 °C intake, 0 XID | integrator range 24 to 72 h; this line runs 24 h |
Two rows deserve a note. The memory bandwidth floor is not DCGM's: the example configuration's 1,230,000 MB/s is for a PCIe card with a third of this module's HBM bandwidth, and a board judged on it passes with a module that has lost a stack. And the NCCL reference is not a theoretical number: NVLink's raw rate is not what a ring all-reduce achieves, so the line measures its first golden nodes, takes the median, and judges every board at 90 % of that.
Test Procedure
Overview
The ladder maps onto the framework's three stages. Level 1 and the inventory live in setup: so no stress runs on a node whose driver is broken or whose topology is wrong; the inventory waits on level 1 through depends_on. Each main level is two phases, the command and its parser, chained one after the other on the single node. The teardown attaches the reports and clears the counters whatever a main phase did.
- Setup:
dcgmi diag -r 1, exit code only. - Setup: inventory, PCIe link, firmware, NVLink, serial, ECC baseline.
- Main:
dcgmi diag -r 2, then memory and PCIe bandwidth per GPU parsed. - Main:
dcgmi diag -r 3with targeted_power for 300 s, then power, temperature and throttles parsed. - Main:
all_reduce_perfacross the 8 GPUs, then the bus bandwidth curve parsed. - Main:
dcgmi diag -r 4, then memtest results and ECC minus the baseline. - Main: 24 h soak sampled hourly, ECC minus the memtest counters, XID.
- Teardown: reports attached, GPU serials on the unit, counters cleared.
Every metric validates against limits declared in procedure.yaml, and results stream to TofuPilot as the per-board evidence.
Why TofuPilot Framework?
TofuPilot Framework is a YAML + Python test framework built for hardware manufacturing. Instead of writing all your test logic, measurements, and limits inside Python code, you describe what the test does in a procedure.yaml file, and how in small Python phase files. The framework handles:
- Automatic Python environment management (via
uv) - Operator UI (no frontend code needed)
- Measurement validation and live charts
- Process isolation between phases and equipment plugs
Project Structure
You can find the full source on GitHub. The NodeAgent plug is a mock of nvidia-smi, the BMC and the kernel log, and the two scripts under scripts/ stand in for dcgmi diag and all_reduce_perf: they print DCGM-shaped JSON and the all_reduce_perf table and exit 0, so the executable phases judge a real exit code and the parsers read real files. The mock synthesizes a healthy board with eight modules between 3.07 and 3.13 TB/s, 98.5 % of TDP reached, 462 GB/s of all-reduce bus bandwidth, and a few correctable ECC events on GPU 4. Time is scaled, one hour of the real ladder to one second, so the procedure runs end to end in under a minute without a node connected.
tofupilot run .For CI or bench automation, the same run executes headless:
tofupilot run . --no-tui --no-kiosk --jsonThe Procedure File
procedure.yaml declares the unit, the node plug with the label serial as constructor argument, and the three stages with every command, measurement and limit:
procedure.yaml399 lines
name: GPU Baseboard Diagnostic Ladderversion: 0.1.0description: L10 diagnostic ladder for an 8-GPU HGX / OAM-UBB baseboard in its server node, wrapped around NVIDIA DCGM. Inventory and NVLink topology against the golden configuration, dcgmi diag levels 1 to 4 as executable phases judged on their exit code with Python phases that parse the JSON reports, targeted_power to TDP, nccl_tests all_reduce across the fabric, the HBM memtest patterns with the ECC counters subtracted from the inventory baseline, a 24 hour soak at elevated intake with the counters subtracted again, and a teardown that attaches every raw report and clears the counters.unit: auto_identify: true serial_number: description: "Scan the data-matrix on the baseboard's edge, or read it from the BMC" placeholder: "BB8-000000-0000" pattern: "^BB8-\\d{6}-\\d{4}$" default_value: "BB8-260922-0417" part_number: default_value: "GPU-BASEBOARD-8X-HBM3" batch_number: default_value: "LOT-2026-38"plugs: - name: Node Agent description: "nvidia-smi, the BMC's Redfish API and the kernel log of the node under test (mock, one plug per station)" python: plugs.node_agent:NodeAgent key: node config: serial_number: "BB8-260922-0417"setup: - name: DCGM Level 1 key: dcgm_r1 description: "Software checks only: driver, NVML, CUDA libraries, persistence mode, denylist. Nothing to parse; the exit code is the result. On a real node the command is dcgmi diag -r 1 -j." executable: command: "mkdir -p results && python3 scripts/dcgm_diag_mock.py -r 1 -j > results/dcgm_r1.json" timeout: 2m - name: Inventory key: inventory python: phases.inventory depends_on: [dcgm_r1] measurements: - name: GPU Count key: gpu_count description: GPUs nvidia-smi enumerates on the baseboard. validators: - {operator: "==", expected_value: 8} - name: PCIe Link key: pcie_link title: PCIe link generation and width per GPU x_axis: legend: GPU y_axis: - legend: Generation key: gen aggregations: - type: min_gen validators: - {operator: "==", expected_value: 5} - legend: Width key: width unit: lanes aggregations: - type: min_width validators: - {operator: "==", expected_value: 16} - name: Firmware key: firmware description: "Driver, VBIOS and DCGM version as one object against the release. DCGM's example configuration asks for gen3 x16 at least; this board's golden configuration is gen5 x16." validators: - operator: "==" expected_value: driver: 570.86.15 vbios: 96.00.89.00.01 dcgm: 3.3.9 - name: NVLink key: nvlink title: NVLink links up per GPU x_axis: legend: GPU y_axis: - legend: Links up key: links_up aggregations: - type: min_links validators: - {operator: "==", expected_value: 18} - name: All NVLinks Up key: all_nvlinks_up description: Every GPU reports the full link count of this board's topology. validators: - {operator: "==", expected_value: true} - name: Serial Matches Label key: serial_matches_label description: The baseboard serial the BMC reports is the one on the label. validators: - {operator: "==", expected_value: true} - name: ECC Baseline key: ecc_baseline description: "Volatile ECC and row-remap counters per GPU before any stress, kept for the memtest phase to subtract."main: - name: DCGM Level 2 key: dcgm_r2_run description: "PCIe, NVLink, memory allocation and memory bandwidth. Executable phase, judged on the exit code; the report is parsed by the next phase. On a real node the command is dcgmi diag -r 2 -j." executable: command: "python3 scripts/dcgm_diag_mock.py -r 2 -j > results/dcgm_r2.json" timeout: 15m - name: Level 2 Bandwidth key: dcgm_r2 python: phases.dcgm_r2 depends_on: [dcgm_r2_run] measurements: - name: DCGM Level 2 All Pass key: dcgm_r2_all_pass validators: - {operator: "==", expected_value: true} - name: Memory Bandwidth key: memory_bandwidth title: HBM bandwidth per GPU from the DCGM memory_bandwidth test x_axis: legend: GPU y_axis: - legend: Memory bandwidth key: mb_s unit: MB/s aggregations: - type: min_mb_s unit: MB/s validators: - {operator: ">=", expected_value: 2850000} - type: spread_pct unit: "%" validators: - {operator: "<=", expected_value: 5.0} - name: PCIe Bandwidth key: pcie_bandwidth title: Host-to-device bandwidth per GPU from the DCGM PCIe test x_axis: legend: GPU y_axis: - legend: Host to device key: h2d_gb_s unit: GB/s aggregations: - type: min_gb_s unit: GB/s validators: - {operator: ">=", expected_value: 45.0} - name: DCGM Level 3 key: dcgm_r3_run description: "Targeted stress and targeted_power for the line's 300 s. On a real node the command is dcgmi diag -r 3 -j -p targeted_power.test_duration=300." executable: command: "python3 scripts/dcgm_diag_mock.py -r 3 -j -p targeted_power.test_duration=300 > results/dcgm_r3.json" depends_on: [dcgm_r2] timeout: 30m - name: Level 3 Targeted Power key: dcgm_r3_targeted_power python: phases.dcgm_r3_targeted_power depends_on: [dcgm_r3_run] measurements: - name: DCGM Level 3 All Pass key: dcgm_r3_all_pass validators: - {operator: "==", expected_value: true} - name: Targeted Power key: targeted_power title: Power reached and hottest sensor per GPU at the TDP target x_axis: legend: GPU y_axis: - legend: Achieved power key: achieved_w unit: W aggregations: - type: min_pct_of_tdp unit: "%" validators: - {operator: ">=", expected_value: 95.0} - type: min_w unit: W - legend: Max temperature key: max_temp_c unit: °C aggregations: - type: max_c unit: °C validators: - {operator: "<=", expected_value: 85.0} - name: Throttle Events key: throttle_events description: "Clock throttle events across the 8 GPUs during targeted_power. A module that reaches TDP by throttling has a cold plate that is not seated." validators: - {operator: "==", expected_value: 0} - name: Targeted Power Duration key: targeted_power_duration_s unit: s description: "The duration DCGM reports, which must be the one asked for." validators: - {operator: "==", expected_value: 300} - name: NCCL All-Reduce key: nccl_run description: "nccl_tests all_reduce_perf across the 8 GPUs, 8 B to 8 GiB doubling, with validation. On a real node the command is all_reduce_perf -b 8 -e 8G -f 2 -g 8 -c 1." executable: command: "python3 scripts/nccl_allreduce_mock.py -b 8 -e 8G -f 2 -g 8 -c 1 > results/nccl_allreduce.txt" depends_on: [dcgm_r3_targeted_power] timeout: 15m - name: NCCL Bus Bandwidth key: nccl_allreduce python: phases.nccl_allreduce depends_on: [nccl_run] measurements: - name: All-Reduce Bus Bandwidth key: allreduce_busbw title: all_reduce_perf bus and algorithm bandwidth against message size x_axis: legend: Message size unit: B y_axis: - legend: Bus bandwidth key: busbw_gb_s unit: GB/s aggregations: - type: peak_gb_s unit: GB/s validators: - {operator: ">=", expected_value: 432.0} - type: peak_pct_of_ref unit: "%" validators: - {operator: ">=", expected_value: 90.0} - legend: Algorithm bandwidth key: algbw_gb_s unit: GB/s - name: NCCL Wrong Values key: nccl_wrong_values description: Elements the validation pass found wrong, out-of-place and in-place summed over the sweep. validators: - {operator: "==", expected_value: 0} - name: DCGM Level 4 key: dcgm_r4_run description: "HBM memtest patterns and the pulse test, about two hours on 8 GPUs. On a real node the command is dcgmi diag -r 4 -j." executable: command: "python3 scripts/dcgm_diag_mock.py -r 4 -j > results/dcgm_r4.json" depends_on: [nccl_allreduce] timeout: 3h - name: HBM Memtest and ECC key: hbm_memtest python: phases.hbm_memtest depends_on: [dcgm_r4_run] measurements: - name: DCGM Level 4 All Pass key: dcgm_r4_all_pass validators: - {operator: "==", expected_value: true} - name: Memtest key: memtest title: Memtest errors and duration per GPU x_axis: legend: GPU y_axis: - legend: Errors key: errors aggregations: - type: max_errors validators: - {operator: "==", expected_value: 0} - legend: Duration key: duration_s unit: s aggregations: - type: max_s unit: s - name: ECC After Memtest key: ecc_after_memtest title: ECC and row-remap counters per GPU, memtest minus inventory baseline x_axis: legend: GPU y_axis: - legend: Correctable key: correctable_delta aggregations: - type: max_per_gpu validators: - {operator: "<=", expected_value: 10} - legend: Uncorrectable key: uncorrectable_delta aggregations: - type: max_per_gpu validators: - {operator: "==", expected_value: 0} - legend: Rows pending remap key: row_remap_pending aggregations: - type: max_per_gpu validators: - {operator: "==", expected_value: 0} - name: ECC Counters After Memtest key: ecc_counters_after_memtest description: "The counters as read after the memtest, kept for the soak phase to subtract." - name: Soak key: soak python: phases.soak depends_on: [hbm_memtest] measurements: - name: Soak Trace key: soak_trace title: Hottest GPU, intake temperature and board power over the soak x_axis: legend: Time unit: h y_axis: - legend: Hottest GPU key: hottest_gpu_c unit: °C aggregations: - type: max_c unit: °C validators: - {operator: "<=", expected_value: 85.0} - legend: Intake key: intake_c unit: °C aggregations: - type: mean_c unit: °C validators: - {operator: ">=", expected_value: 33.0} - {operator: "<=", expected_value: 37.0} - legend: Board power key: board_power_kw unit: kW aggregations: - type: mean_kw unit: kW - name: Soak Per GPU key: soak_per_gpu title: Per-GPU maximum temperature, minimum SM clock and ECC counters over the soak x_axis: legend: GPU y_axis: - legend: Max temperature key: max_temp_c unit: °C aggregations: - type: max_c unit: °C validators: - {operator: "<=", expected_value: 85.0} - legend: Min SM clock key: min_sm_clock_mhz unit: MHz aggregations: - type: min_mhz unit: MHz validators: - {operator: ">=", expected_value: 1500} - legend: Correctable ECC key: correctable_delta aggregations: - type: max_per_gpu validators: - {operator: "<=", expected_value: 10} - legend: Uncorrectable ECC key: uncorrectable_delta aggregations: - type: max_per_gpu validators: - {operator: "==", expected_value: 0} - legend: Rows pending remap key: row_remap_pending aggregations: - type: max_per_gpu validators: - {operator: "==", expected_value: 0} - name: XID Events key: xid_events description: XID lines in the kernel log over the soak. Any XID is a reason to look, whatever the counters say. validators: - {operator: "==", expected_value: 0}teardown: - name: Clear and Report key: clear_and_report python: phases.clear_and_report measurements: - name: ECC Counters Cleared key: ecc_counters_cleared description: Volatile counters at zero after the reset, so the first event the customer reads happened in their rack. validators: - {operator: "==", expected_value: true} - name: Reports Attached key: reports_attached description: The four DCGM reports and the NCCL log on the run. validators: - {operator: "==", expected_value: 5}Framework features to notice:
- Executable phases judged on the exit code.
dcgm_r1,dcgm_r2_run,dcgm_r3_run,nccl_runanddcgm_r4_runhave no Python:executable.commandruns throughsh, stdout and stderr land in the phase log, and a non-zero exit fails the phase. Level 1 is nothing but that. - A parser chained to each command.
dcgm_r2,dcgm_r3_targeted_power,nccl_allreduceandhbm_memtestdeclaredepends_onon their executable and read the file it wrote. The command is the only line that changes on a real node. - Previous-results injection.
hbm_memtest(measurements, node, inventory, log)receives the inventory phase's results by naming the phase key as a parameter and subtracts itsecc_baseline;soakdoes the same withhbm_memtest.ecc_counters_after_memtest. Each stage's ECC ceiling applies to that stage alone. - Per-GPU measurements with custom aggregations. Every per-GPU result is one multi-dimensional measurement with the GPU index on the x-axis:
pcie_linkjudged onmin_genandmin_width,memory_bandwidthonmin_mb_sandspread_pct,targeted_poweronmin_pct_of_tdpandmax_c,ecc_after_memtestandsoak_per_gpuonmax_per_gpu. - Attachments and metadata. The teardown calls
attach.fileon the four DCGM reports and the NCCL log, writes the eight GPU serials intounit.metadata, and the inventory writes the DCGM version, the soak length and the mock time scale intorun.metadata. - A
timeoutper level. Level 4 is allowed 3 hours because DCGM's own figure is about two hours on eight GPUs; the soak carries no timeout because it is longer than the 24 h cap and controls its own duration.
DCGM Level 1 and Inventory
Level 1 is the only phase in the procedure with no measurement: the software checks pass or fail, and sh reports the exit code. The inventory that follows reads what the node says it is, keeps the PCIe link and the NVLink count per GPU as multi-dimensional measurements judged on their minimum, compares the firmware set as one object, checks the BMC's serial against the label, and records the ECC counters as the baseline the memtest phase will subtract:
phases/inventory.py36 lines
from utils.recipe import GPU_COUNT, NVLINK_LINKS_PER_GPU, SOAK_HOURS, TIME_SCALEdef inventory(measurements, node, unit, run, log): """Setup: what the node says it is, before anything is stressed. Eight GPUs enumerated at the golden PCIe generation and width, the firmware set as one object against the release, every NVLink up, and the ECC counters as they stand, which the memtest phase later subtracts.""" gpus = node.gpu_inventory() fw = node.firmware() links = node.nvlink_status() ecc = node.ecc_counters() serial = node.baseboard_serial() measurements.gpu_count = len(gpus) m = measurements.pcie_link m.x_axis = [g["index"] for g in gpus] m.y_axis.gen = [g["pcie_gen"] for g in gpus] m.y_axis.gen.aggregations.min_gen = min(g["pcie_gen"] for g in gpus) m.y_axis.width = [g["pcie_width"] for g in gpus] m.y_axis.width.aggregations.min_width = min(g["pcie_width"] for g in gpus) measurements.firmware = fw n = measurements.nvlink n.x_axis = [g["index"] for g in gpus] n.y_axis.links_up = links n.y_axis.links_up.aggregations.min_links = min(links) measurements.all_nvlinks_up = all(l == NVLINK_LINKS_PER_GPU for l in links) measurements.serial_matches_label = serial == unit.serial_number measurements.ecc_baseline = ecc unit.metadata["driver"] = fw["driver"] unit.metadata["vbios"] = fw["vbios"] run.metadata["dcgm_version"] = fw["dcgm"] run.metadata["soak_hours"] = SOAK_HOURS run.metadata["mock_time_scale"] = TIME_SCALE log.info(f"{serial}: {len(gpus)} of {GPU_COUNT} GPUs, PCIe gen {min(g['pcie_gen'] for g in gpus)} x{min(g['pcie_width'] for g in gpus)}, driver {fw['driver']}, {min(links)} NVLinks up per GPU, correctable ECC baseline {[v['correctable'] for v in ecc.values()]}")DCGM Level 2 and Bandwidth
dcgmi diag -r 2 -j > results/dcgm_r2.json runs PCIe, NVLink, memory allocation and memory bandwidth; the phase after it reads the report, keeps the memory bandwidth and the host-to-device bandwidth per GPU, and judges each on its minimum. The spread aggregation catches a board whose eight modules pass the floor but do not match each other:
phases/dcgm_r2.py28 lines
from utils.dcgm import all_passed, load_report, number_after, test_resultsfrom utils.recipe import MEM_BW_FLOOR_MB_S, PCIE_BW_FLOOR_GB_S, RESULTS_DIRdef dcgm_r2(measurements, log): """Level 2 parsed: the report dcgm_r2_run wrote. The exit code already said pass or fail; this phase keeps the numbers, memory bandwidth and PCIe bandwidth per GPU, and judges each against this line's floor so a board that passes DCGM's default floor but sits 20 % under its siblings is caught here.""" report = load_report(RESULTS_DIR / "dcgm_r2.json") mem = test_results(report, "Memory Bandwidth") pcie = test_results(report, "PCIe") mem_bw = [number_after(r["info"], "memory bandwidth") for r in mem] h2d = [number_after(r["info"], "host-to-device") for r in pcie] gpus = list(range(len(mem))) measurements.dcgm_r2_all_pass = all_passed(report) m = measurements.memory_bandwidth m.x_axis = gpus m.y_axis.mb_s = mem_bw m.y_axis.mb_s.aggregations.min_mb_s = min(mem_bw) m.y_axis.mb_s.aggregations.spread_pct = round(100.0 * (max(mem_bw) - min(mem_bw)) / max(mem_bw), 2) p = measurements.pcie_bandwidth p.x_axis = gpus p.y_axis.h2d_gb_s = h2d p.y_axis.h2d_gb_s.aggregations.min_gb_s = min(h2d) log.info(f"DCGM r2 {report['version']}: memory bandwidth {min(mem_bw):,.0f} to {max(mem_bw):,.0f} MB/s against a {MEM_BW_FLOOR_MB_S:,} floor, PCIe host-to-device {min(h2d):.1f} GB/s min against {PCIE_BW_FLOOR_GB_S:.0f}")The DCGM report is one object under DCGM Diagnostic with a list of test categories, each holding tests with a per-GPU list of results; the numbers travel in each result's info string. utils/dcgm.py holds the readers, so a change of wording between DCGM versions is a change of label in one file:
utils/dcgm.py42 lines
"""Readers for the DCGM diagnostic report (`dcgmi diag -j`) and for thenumbers DCGM puts in each result's info string."""import jsonimport redef load_report(path): """The report as dcgmi writes it: one object under 'DCGM Diagnostic'.""" with open(path) as f: return json.load(f)["DCGM Diagnostic"]def test_results(report, test_name): """The per-GPU results of one named test, in GPU order.""" for category in report["test_categories"]: for test in category["tests"]: if test["name"] == test_name: return sorted(test["results"], key=lambda r: int(r.get("gpu_id", 0))) raise KeyError(f"test {test_name!r} not in the report")def all_passed(report): return all(r["status"] == "Pass" for c in report["test_categories"] for t in c["tests"] for r in t["results"])def number_after(info, label): """The number that follows a label in an info string, as a float: number_after("achieved 694.2 W over 300 s", "achieved") is 694.2. DCGM's wording changes between versions; adjust the labels here, not the phases.""" m = re.search(re.escape(label) + r"\s*(-?[\d,]+(?:\.\d+)?)", info) if not m: raise ValueError(f"no number after {label!r} in {info!r}") return float(m.group(1).replace(",", ""))def number_before(info, label): m = re.search(r"(-?[\d,]+(?:\.\d+)?)\s*" + re.escape(label), info) if not m: raise ValueError(f"no number before {label!r} in {info!r}") return float(m.group(1).replace(",", ""))DCGM Level 3 and Targeted Power
dcgmi diag -r 3 -j -p targeted_power.test_duration=300 drives every GPU to its power target for the line's 300 s. The parser records the power reached per GPU as a percentage of the 700 W limit, the hottest sensor, the throttle count summed over the eight modules and the duration DCGM reports, which must be the one asked for:
phases/dcgm_r3_targeted_power.py29 lines
from utils.dcgm import all_passed, load_report, number_after, number_before, test_resultsfrom utils.recipe import GPU_TDP_W, RESULTS_DIR, TARGETED_POWER_Sdef dcgm_r3_targeted_power(measurements, log): """Level 3 parsed: targeted_power drove every GPU to its power limit for the line's duration. Achieved power per GPU is judged as a percentage of TDP, the hottest sensor against the line's ceiling, and the throttle count must be zero: a module that reaches TDP by throttling is a module whose cold plate is not seated.""" report = load_report(RESULTS_DIR / "dcgm_r3.json") rows = test_results(report, "Targeted Power") achieved = [number_after(r["info"], "achieved") for r in rows] temps = [number_after(r["info"], "max temperature") for r in rows] throttles = [number_before(r["info"], "throttle events") for r in rows] duration = number_after(rows[0]["info"], "over") pct = [100.0 * w / GPU_TDP_W for w in achieved] measurements.dcgm_r3_all_pass = all_passed(report) m = measurements.targeted_power m.x_axis = list(range(len(rows))) m.y_axis.achieved_w = achieved m.y_axis.achieved_w.aggregations.min_pct_of_tdp = round(min(pct), 2) m.y_axis.achieved_w.aggregations.min_w = min(achieved) m.y_axis.max_temp_c = temps m.y_axis.max_temp_c.aggregations.max_c = max(temps) measurements.throttle_events = int(sum(throttles)) measurements.targeted_power_duration_s = duration log.info(f"DCGM r3 targeted_power: {duration:.0f} s at {GPU_TDP_W:.0f} W target (asked {TARGETED_POWER_S} s), achieved {min(achieved):.1f} to {max(achieved):.1f} W ({min(pct):.1f} % of TDP min), hottest {max(temps):.0f} C, {int(sum(throttles))} throttle events")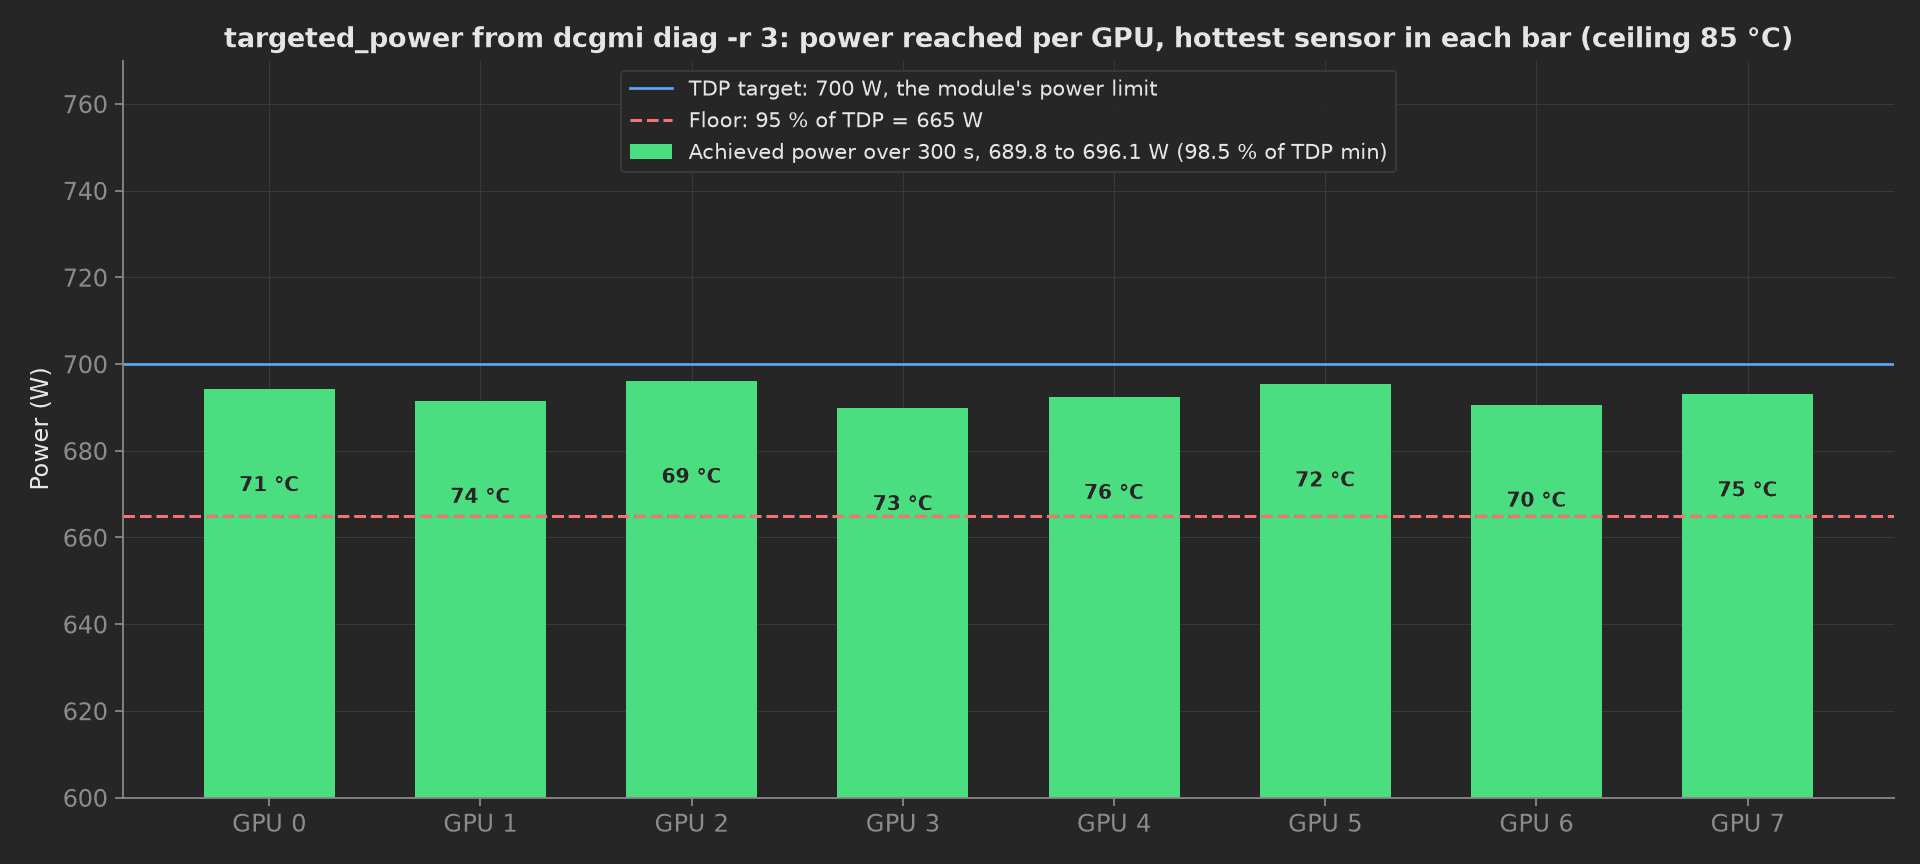
The mock board at the power target: 689.8 to 696.1 W, 98.5 % of TDP on the lowest module, 69 to 76 °C at the hottest sensor with the intake at room temperature. A module that reaches the target only by throttling, or that sits 10 °C above its siblings at the same power, is a cold plate that is not seated; both show here before the soak.
NCCL All-Reduce
all_reduce_perf -b 8 -e 8G -f 2 -g 8 -c 1 > results/nccl_allreduce.txt runs the collective across the eight GPUs over 31 message sizes with validation on. The parser reads the data rows of the table, keeps the bus and algorithm bandwidth curves whole, and judges the bus bandwidth at the top of the sweep against the line's reference:
phases/nccl_allreduce.py38 lines
from utils.recipe import NCCL_BUSBW_FLOOR_PCT, NCCL_BUSBW_REF_GB_S, RESULTS_DIRdef parse_all_reduce_perf(path): """The data rows of all_reduce_perf: size in bytes, out-of-place algbw and busbw in GB/s, and the wrong-value count of both passes. Comment lines start with '#'.""" sizes, algbw, busbw, wrong = [], [], [], 0 with open(path) as f: for line in f: if line.startswith("#") or not line.strip(): continue cols = line.split() sizes.append(int(cols[0])) algbw.append(float(cols[6])) busbw.append(float(cols[7])) wrong += int(cols[8]) + int(cols[12]) return sizes, algbw, busbw, wrongdef nccl_allreduce(measurements, log): """The NVLink fabric under the collective the customer will run: all_reduce_perf across the 8 GPUs over the message-size sweep, judged on the bus bandwidth it reaches at the top of the sweep against the line's expected value. A GPU with one NVLink down passes DCGM's link test and loses a fifth of its bus bandwidth here.""" sizes, algbw, busbw, wrong = parse_all_reduce_perf(RESULTS_DIR / "nccl_allreduce.txt") peak = max(busbw) pct = 100.0 * peak / NCCL_BUSBW_REF_GB_S m = measurements.allreduce_busbw m.x_axis = sizes m.y_axis.busbw_gb_s = busbw m.y_axis.busbw_gb_s.aggregations.peak_gb_s = round(peak, 2) m.y_axis.busbw_gb_s.aggregations.peak_pct_of_ref = round(pct, 2) m.y_axis.algbw_gb_s = algbw measurements.nccl_wrong_values = wrong log.info(f"all_reduce_perf: {len(sizes)} sizes from {sizes[0]} B to {sizes[-1] >> 30} GiB, bus bandwidth peaks at {peak:.1f} GB/s, {pct:.1f} % of the {NCCL_BUSBW_REF_GB_S:.0f} GB/s reference (floor {NCCL_BUSBW_FLOOR_PCT:.0f} %), {wrong} wrong values")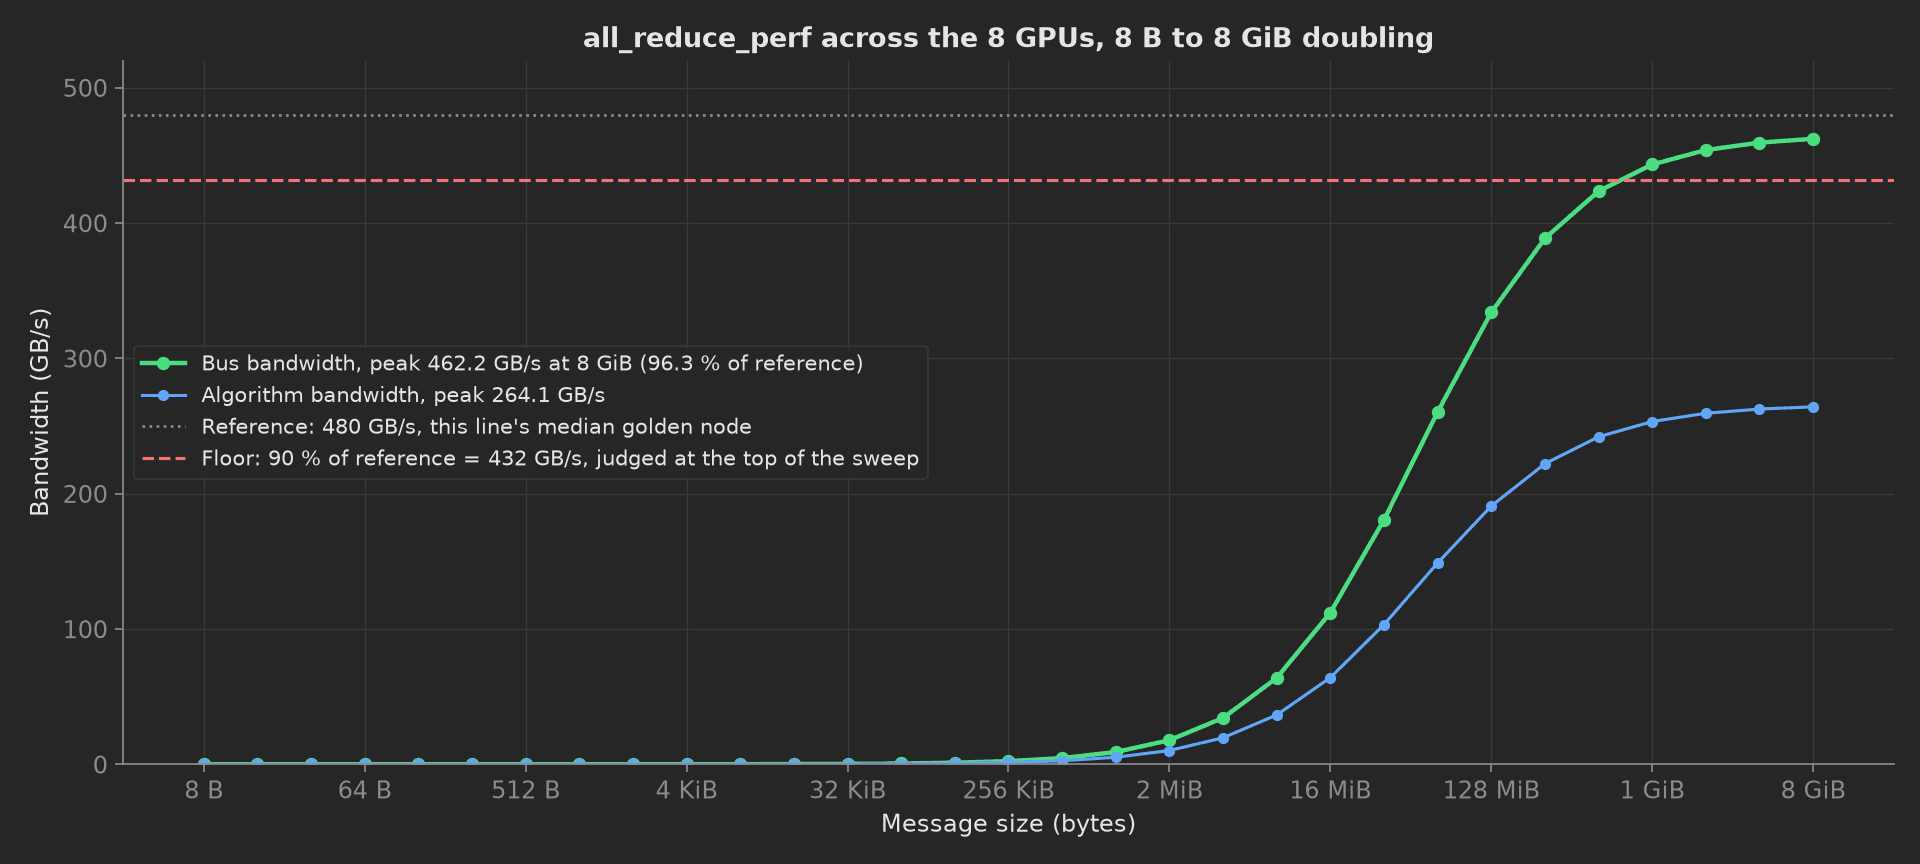
The mock fabric: latency-bound below a megabyte, saturating past 1 GiB at 462 GB/s, 96.3 % of the reference. A GPU with one NVLink lane trained down passes DCGM's link check and moves the top of this curve by a fifth, which is why the bus bandwidth is judged and not the link count alone.
DCGM Level 4 and ECC
dcgmi diag -r 4 -j > results/dcgm_r4.json walks the HBM memtest patterns and the pulse test over about two hours on eight GPUs. The parser reads the errors and the duration per GPU, then reads the ECC and row-remap counters a second time and subtracts the inventory phase's baseline, which the framework injects because the function names inventory as a parameter:
phases/hbm_memtest.py44 lines
from utils.dcgm import all_passed, load_report, number_after, number_before, test_resultsfrom utils.recipe import ECC_CORRECTABLE_CEILING, RESULTS_DIRdef ecc_delta(after, before, field): """Per-GPU change of one ECC counter between two reads, in GPU order.""" return [after[k][field] - before[k][field] for k in sorted(after, key=int)]def hbm_memtest(measurements, node, inventory, log): """Level 4 parsed, then the field acceptance rule. The memtest patterns walked every HBM row; the report says how long and how many errors. The ECC counters are read again and the inventory phase's baseline is subtracted: zero uncorrectable, no row pending a remap, and a ceiling on correctable events per GPU, because a stack that corrects on every pattern is a stack that will remap rows in the customer's rack.""" report = load_report(RESULTS_DIR / "dcgm_r4.json") rows = test_results(report, "Memtest") errors = [number_before(r["info"], "errors") for r in rows] durations = [number_after(r["info"], "errors,") for r in rows] after = node.ecc_counters() before = inventory.ecc_baseline corr = ecc_delta(after, before, "correctable") uncorr = ecc_delta(after, before, "uncorrectable") pending = [after[k]["row_remap_pending"] for k in sorted(after, key=int)] gpus = list(range(len(rows))) measurements.dcgm_r4_all_pass = all_passed(report) m = measurements.memtest m.x_axis = gpus m.y_axis.errors = errors m.y_axis.errors.aggregations.max_errors = max(errors) m.y_axis.duration_s = durations m.y_axis.duration_s.aggregations.max_s = max(durations) e = measurements.ecc_after_memtest e.x_axis = gpus e.y_axis.correctable_delta = corr e.y_axis.correctable_delta.aggregations.max_per_gpu = max(corr) e.y_axis.uncorrectable_delta = uncorr e.y_axis.uncorrectable_delta.aggregations.max_per_gpu = max(uncorr) e.y_axis.row_remap_pending = pending e.y_axis.row_remap_pending.aggregations.max_per_gpu = max(pending) measurements.ecc_counters_after_memtest = after log.info(f"DCGM r4 memtest: {max(durations):.0f} s longest, {int(sum(errors))} errors; ECC since inventory: correctable {corr} (ceiling {ECC_CORRECTABLE_CEILING} per GPU), uncorrectable {uncorr}, rows pending remap {pending}")The counters as read are also kept as a JSON measurement with no validator, ecc_counters_after_memtest, so the soak can subtract them in turn.
Soak
The node under its burn-in load at 35 °C intake for 24 hours, sampled once an hour through the node agent. The phase keeps a trace of the hottest GPU, the intake and the board power against time, and per GPU the maximum temperature and the minimum SM clock over the day. At the end the counters are read a third time and the memtest phase's counters subtracted, and the kernel log must hold no XID. The mock scales one hour to one second and says so in the phase log:
phases/soak.py57 lines
import timefrom phases.hbm_memtest import ecc_deltafrom utils.recipe import SOAK_HOURS, SOAK_INTAKE_C, SOAK_SAMPLE_MIN, TEMP_CEILING_C, TIME_SCALEdef soak(measurements, node, hbm_memtest, log): """The soak: the node under its burn-in load at elevated intake temperature for the line's 24 h, sampled once an hour. Two views are kept: the trace of the hottest GPU, the intake and the board power against time, and per GPU the maximum temperature and the minimum SM clock over the day. At the end the ECC counters are read a third time and the memtest phase's counters subtracted, so the ceiling applies to the soak alone, and the kernel log must hold no XID. The mock scales one hour to one second.""" samples = list(range(0, SOAK_HOURS + 1, max(1, SOAK_SAMPLE_MIN // 60))) hottest, intake, board_kw = [], [], [] per_gpu_max_c = None per_gpu_min_mhz = None log.info(f"Soak: {SOAK_HOURS} h at {SOAK_INTAKE_C:.0f} C intake, sampled every {SOAK_SAMPLE_MIN} min (mock: {SOAK_HOURS * 3600 / TIME_SCALE:.0f} s)") for hour in samples: s = node.soak_sample(hour) hottest.append(max(s["temp_c"])) intake.append(s["intake_c"]) board_kw.append(round(sum(s["power_w"]) / 1000.0, 3)) per_gpu_max_c = s["temp_c"] if per_gpu_max_c is None else [max(a, b) for a, b in zip(per_gpu_max_c, s["temp_c"])] per_gpu_min_mhz = s["sm_clock_mhz"] if per_gpu_min_mhz is None else [min(a, b) for a, b in zip(per_gpu_min_mhz, s["sm_clock_mhz"])] time.sleep(3600.0 / TIME_SCALE) after = node.ecc_counters() before = hbm_memtest.ecc_counters_after_memtest corr = ecc_delta(after, before, "correctable") uncorr = ecc_delta(after, before, "uncorrectable") pending = [after[k]["row_remap_pending"] for k in sorted(after, key=int)] xids = node.xid_events() t = measurements.soak_trace t.x_axis = samples t.y_axis.hottest_gpu_c = hottest t.y_axis.hottest_gpu_c.aggregations.max_c = max(hottest) t.y_axis.intake_c = intake t.y_axis.intake_c.aggregations.mean_c = round(sum(intake) / len(intake), 2) t.y_axis.board_power_kw = board_kw t.y_axis.board_power_kw.aggregations.mean_kw = round(sum(board_kw) / len(board_kw), 3) g = measurements.soak_per_gpu g.x_axis = list(range(len(per_gpu_max_c))) g.y_axis.max_temp_c = per_gpu_max_c g.y_axis.max_temp_c.aggregations.max_c = max(per_gpu_max_c) g.y_axis.min_sm_clock_mhz = per_gpu_min_mhz g.y_axis.min_sm_clock_mhz.aggregations.min_mhz = min(per_gpu_min_mhz) g.y_axis.correctable_delta = corr g.y_axis.correctable_delta.aggregations.max_per_gpu = max(corr) g.y_axis.uncorrectable_delta = uncorr g.y_axis.uncorrectable_delta.aggregations.max_per_gpu = max(uncorr) g.y_axis.row_remap_pending = pending g.y_axis.row_remap_pending.aggregations.max_per_gpu = max(pending) measurements.xid_events = xids log.info(f"Soak done: hottest GPU {max(hottest):.1f} C (ceiling {TEMP_CEILING_C:.0f}), board {sum(board_kw) / len(board_kw):.2f} kW mean, SM clock floor {min(per_gpu_min_mhz)} MHz; ECC over the soak: correctable {corr}, uncorrectable {uncorr}, rows pending {pending}; {xids} XID")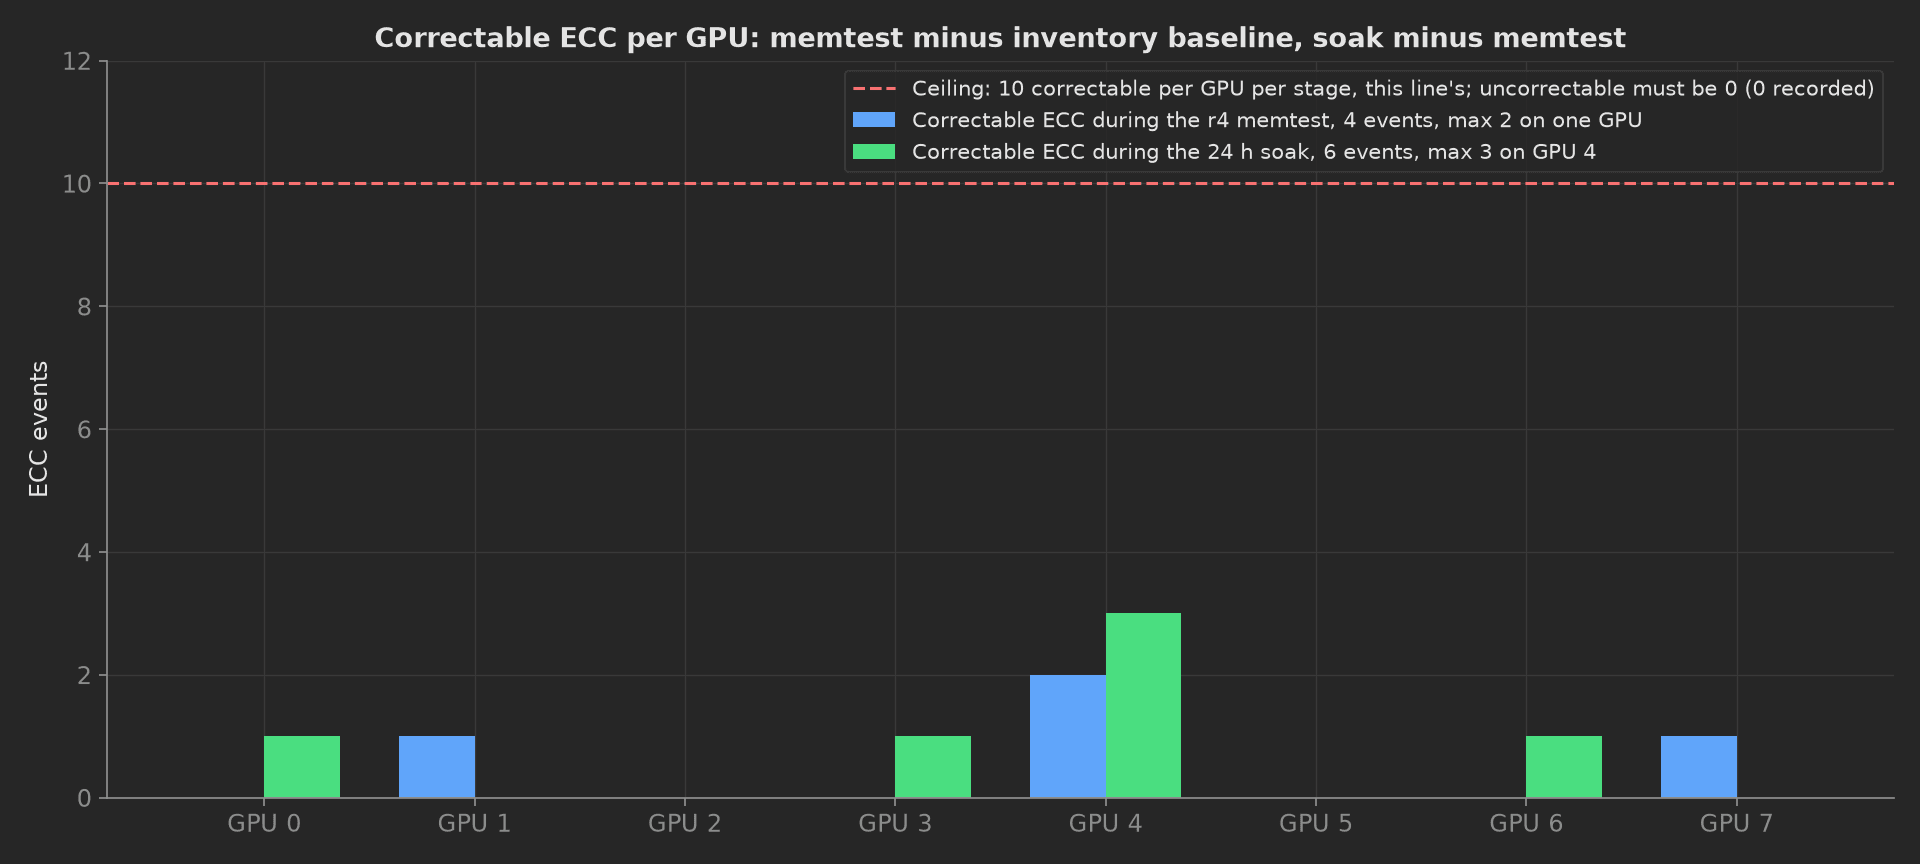
The mock board's ECC story: four correctable events during the memtest and six during the soak, five of them on GPU 4, zero uncorrectable and no row pending a remap. GPU 4 is the module to watch on this board; its serial is on the unit metadata, so a re-test that adds events to the same module is traceable to it.
Clear and Report
The teardown attaches the five raw files to the run, writes the eight GPU serials into the unit metadata so a module traced from a field failure leads back to this board and this run, resets the volatile ECC counters, and records that they read zero:
phases/clear_and_report.py23 lines
from utils.recipe import RESULTS_DIRREPORTS = ["dcgm_r1.json", "dcgm_r2.json", "dcgm_r3.json", "dcgm_r4.json", "nccl_allreduce.txt"]def clear_and_report(measurements, node, unit, attach, log): """Teardown: the raw reports go onto the run as attachments, the GPU serials onto the unit, and the volatile ECC counters back to zero so the first event the customer reads happened in their rack. Runs whatever a main phase did.""" attached = 0 for name in REPORTS: path = RESULTS_DIR / name if path.exists(): attach.file(str(path), name) attached += 1 for g in node.gpu_inventory(): unit.metadata[f"gpu{g['index']}_serial"] = g["serial"] cleared = node.reset_ecc_counters() after = node.ecc_counters() measurements.ecc_counters_cleared = cleared and all(v["correctable"] == 0 and v["uncorrectable"] == 0 for v in after.values()) measurements.reports_attached = attached log.info(f"{attached} reports attached, {len(after)} GPU serials on the unit, ECC counters cleared")Mock Plug
NodeAgent stands in for nvidia-smi, the BMC and the kernel log; the diagnostics themselves are not in the plug, they are the executable phases. In the mock, scripts/dcgm_diag_mock.py and scripts/nccl_allreduce_mock.py print what dcgmi diag -j and all_reduce_perf print and exit 0, and they share the node's state with the plug through plugs/mock_node_state.py, one JSON file under results/ that the level 4 script advances with the memtest's correctable events and the plug reads back as counters. The plug reports eight modules at gen5 x16 with 18 links each, the soak temperatures rising over the first three hours and settling about 3 °C above the stress figures, SM clocks not below 1612 MHz, and a board power of 5.5 kW. Every method returns plain Python types because plug calls cross a JSON boundary; a measurement read back from measurements.<key> returns a proxy, so the phases keep locals for their log lines. The recipe with the golden configuration, the floors and their basis:
utils/recipe.py54 lines
"""Diagnostic ladder for an 8-GPU HGX / OAM-UBB baseboard at L10: the DCGMlevel each phase runs, the stimulus, and the limit each result is judged on.The ladder is NVIDIA DCGM's: `dcgmi diag -r 1` software, `-r 2` PCIe,NVLink, memory and memory bandwidth, `-r 3` the targeted power and stresstests plus nvbandwidth and nccl_tests, `-r 4` the HBM memtest patterns andthe pulse test. DCGM ships an example configuration for an H100 PCIe card(target_power 350 W, memory_bandwidth minimum 1,230,000 MB/s, PCIe atleast gen3 x16); this line's board carries SXM-class modules and sets itsown floors from its golden node. The field acceptance rules, zerouncorrectable ECC and a ceiling on correctable ECC and row-remap eventsduring the soak, are integrator practice. Every limit here is either theDCGM example, the board's golden configuration, or this line's derivation,and procedure.yaml says which."""from pathlib import Path# Unit under test: the baseboard's golden configurationGPU_COUNT = 8PCIE_GEN = 5 # DCGM's example minimum is gen3 x16; this board's links are gen5 x16PCIE_WIDTH = 16NVLINK_LINKS_PER_GPU = 18 # the topology of this board; the count nvidia-smi nvlink -s reports per GPUFIRMWARE = {"driver": "570.86.15", "vbios": "96.00.89.00.01", "dcgm": "3.3.9"}# Level 2: memory bandwidth and PCIe bandwidth floors (this line's)MEM_BW_FLOOR_MB_S = 2_850_000 # 85 % of the module's 3.35 TB/s datasheet figure; DCGM's example floor is 1,230,000 MB/s for a PCIe cardPCIE_BW_FLOOR_GB_S = 45.0 # host-to-device bandwidth on a gen5 x16 link, from the golden node's first article# Level 3: targeted_power drives every GPU to its power limitGPU_TDP_W = 700.0 # the module's power limit as nvidia-smi reports itTARGETED_POWER_S = 300 # this line's; DCGM's default is shorterPOWER_FLOOR_PCT_OF_TDP = 95.0TEMP_CEILING_C = 85.0 # this line's ceiling at the module's hottest sensor during stress and soak# NCCL all_reduce_perf across the 8 GPUsNCCL_MSG_MIN = "8"NCCL_MSG_MAX = "8G"NCCL_BUSBW_REF_GB_S = 480.0 # this line's expected bus bandwidth at 8 GiB, the median of its golden nodesNCCL_BUSBW_FLOOR_PCT = 90.0# Level 4: HBM memtest patterns, then the field acceptance rules on ECCECC_CORRECTABLE_CEILING = 10 # per GPU, per stage (memtest, soak); integrator practice, the number is this line'sROW_REMAP_PENDING_CEILING = 0# Soak at elevated intake temperatureSOAK_HOURS = 24 # 24 to 72 h is the integrator range; this line runs 24 h at L10SOAK_INTAKE_C = 35.0SOAK_SAMPLE_MIN = 60SM_CLOCK_FLOOR_MHZ = 1500 # sustained SM clock under the soak load, from the golden node# Mock time scale: one hour of the real ladder is one second hereTIME_SCALE = 3600.0RESULTS_DIR = Path(__file__).resolve().parents[1] / "results"plugs/node_agent.py90 lines
"""L10 node agent (mock): what the test station reads from the node undertest between the diagnostic runs. nvidia-smi for the inventory, the PCIelink, the NVLink status, the ECC and row-remap counters and the telemetrysamples; the BMC's Redfish API for the baseboard serial and the intaketemperature; the kernel log for XID events.Maps to `nvidia-smi -q -x` and `nvidia-smi nvlink -s` over SSH (or theDCGM Python bindings, `pydcgm`), a Redfish client on the BMC, and`journalctl -k` for the XIDs. The diagnostics themselves, `dcgmi diag` and`all_reduce_perf`, are not here: they are executable phases inprocedure.yaml, and the mock scripts they run share this mock's statethrough plugs/mock_node_state.py. Swap for classes speaking SSH, Redfishand pydcgm; the phases stay unchanged."""import randomfrom plugs import mock_node_state as nodefrom utils.recipe import FIRMWARE, GPU_COUNT, NVLINK_LINKS_PER_GPU, PCIE_GEN, PCIE_WIDTH, SOAK_INTAKE_Cclass NodeAgent: def __init__(self, serial_number): self.serial_number = str(serial_number) self._rng = random.Random(8100) node.reset() # self.ssh = paramiko.SSHClient(...); self.bmc = redfish.redfish_client(...) print(f"Node agent connected: baseboard {self.serial_number}, {GPU_COUNT} GPUs enumerated, BMC reachable") # --- inventory, nvidia-smi -q and Redfish ---------------------------------- def baseboard_serial(self): """The baseboard serial the BMC reports under Chassis/Baseboard.""" return self.serial_number def gpu_inventory(self): """One record per GPU as nvidia-smi -q -x lists them: serial, PCIe link generation and width, VBIOS.""" return [ {"index": i, "serial": node.SERIALS[i], "pcie_gen": PCIE_GEN, "pcie_width": PCIE_WIDTH, "vbios": FIRMWARE["vbios"]} for i in range(GPU_COUNT) ] def firmware(self): """Driver, VBIOS and DCGM version as one object.""" return dict(FIRMWARE) def nvlink_status(self): """Links up per GPU from nvidia-smi nvlink -s.""" return [NVLINK_LINKS_PER_GPU] * GPU_COUNT # --- ECC, row remap and XID, read between the diagnostic runs ------------- def ecc_counters(self): """Volatile ECC and row-remapper counters per GPU: correctable, uncorrectable, rows pending a remap.""" s = node.load() return { str(i): {"correctable": s["correctable"][i], "uncorrectable": s["uncorrectable"][i], "row_remap_pending": s["row_remap_pending"][i]} for i in range(GPU_COUNT) } def reset_ecc_counters(self): """nvidia-smi -p 0: the volatile counters back to zero so the first event the customer reads happened in their rack.""" s = node.load() s["correctable"] = [0] * GPU_COUNT s["uncorrectable"] = [0] * GPU_COUNT node.save(s) return True def xid_events(self): """XID lines in the kernel log since the node booted.""" return node.load()["xid_events"] # --- soak telemetry, sampled once an hour ----------------------------------- def soak_sample(self, hour): """One telemetry sample at the stated soak hour: per-GPU temperature at the hottest sensor, SM clock and power under the soak load, and the intake temperature from the BMC. The mock advances the node's ECC counters for that hour.""" node.apply_soak_hour(hour) temps = [round(t - 3.0 + 3.0 * min(1.0, hour / 3.0) + self._rng.uniform(-0.6, 0.6), 1) for t in node.SOAK_TEMP_C] clocks = [int(c + self._rng.randint(-8, 8)) for c in node.SOAK_SM_CLOCK_MHZ] power = [round(p - 4.0 + self._rng.uniform(-2.0, 2.0), 1) for p in node.POWER_W] return {"temp_c": temps, "sm_clock_mhz": clocks, "power_w": power, "intake_c": round(SOAK_INTAKE_C + self._rng.uniform(-0.3, 0.3), 1)} def __del__(self): print("Node agent released")On a real node, replace the five python3 scripts/... commands in procedure.yaml with dcgmi diag -r 1 -j, -r 2, -r 3 -p targeted_power.test_duration=300, -r 4 and all_reduce_perf -b 8 -e 8G -f 2 -g 8 -c 1, each redirected to the same file under results/, run over SSH or from a station process on the node. Split the plug into an SSH client for nvidia-smi and the kernel log and a Redfish client for the BMC, or use the DCGM Python bindings for the counters. Set the labels in utils/dcgm.py to the DCGM version's wording, or point the parsers at the per-test stats DCGM writes with --statspath. Delete plugs/mock_node_state.py and scripts/. The phases, measurements and limits stay the same.