
Get the complete source, dependencies and setup instructions from the template repository.
Open the source on GitHub ↗Introduction
Thermal Vacuum Overview
A star tracker is a camera whose lens must stay clean and whose focus must hold from -25 to +50 °C in vacuum. Two things on the ground threaten that. Everything inside the unit and around it outgasses when the air is gone, and what comes off the harness, the potting and the adhesives condenses on the coldest optical surface in reach. And every solder joint, every bond and every threaded insert sees its full thermal range for the first time under vacuum, where there is no convection to soften the gradients. The thermal vacuum run answers both: a bakeout with a witness that measures what the unit gives off, and acceptance cycles with a functional check at each extreme.
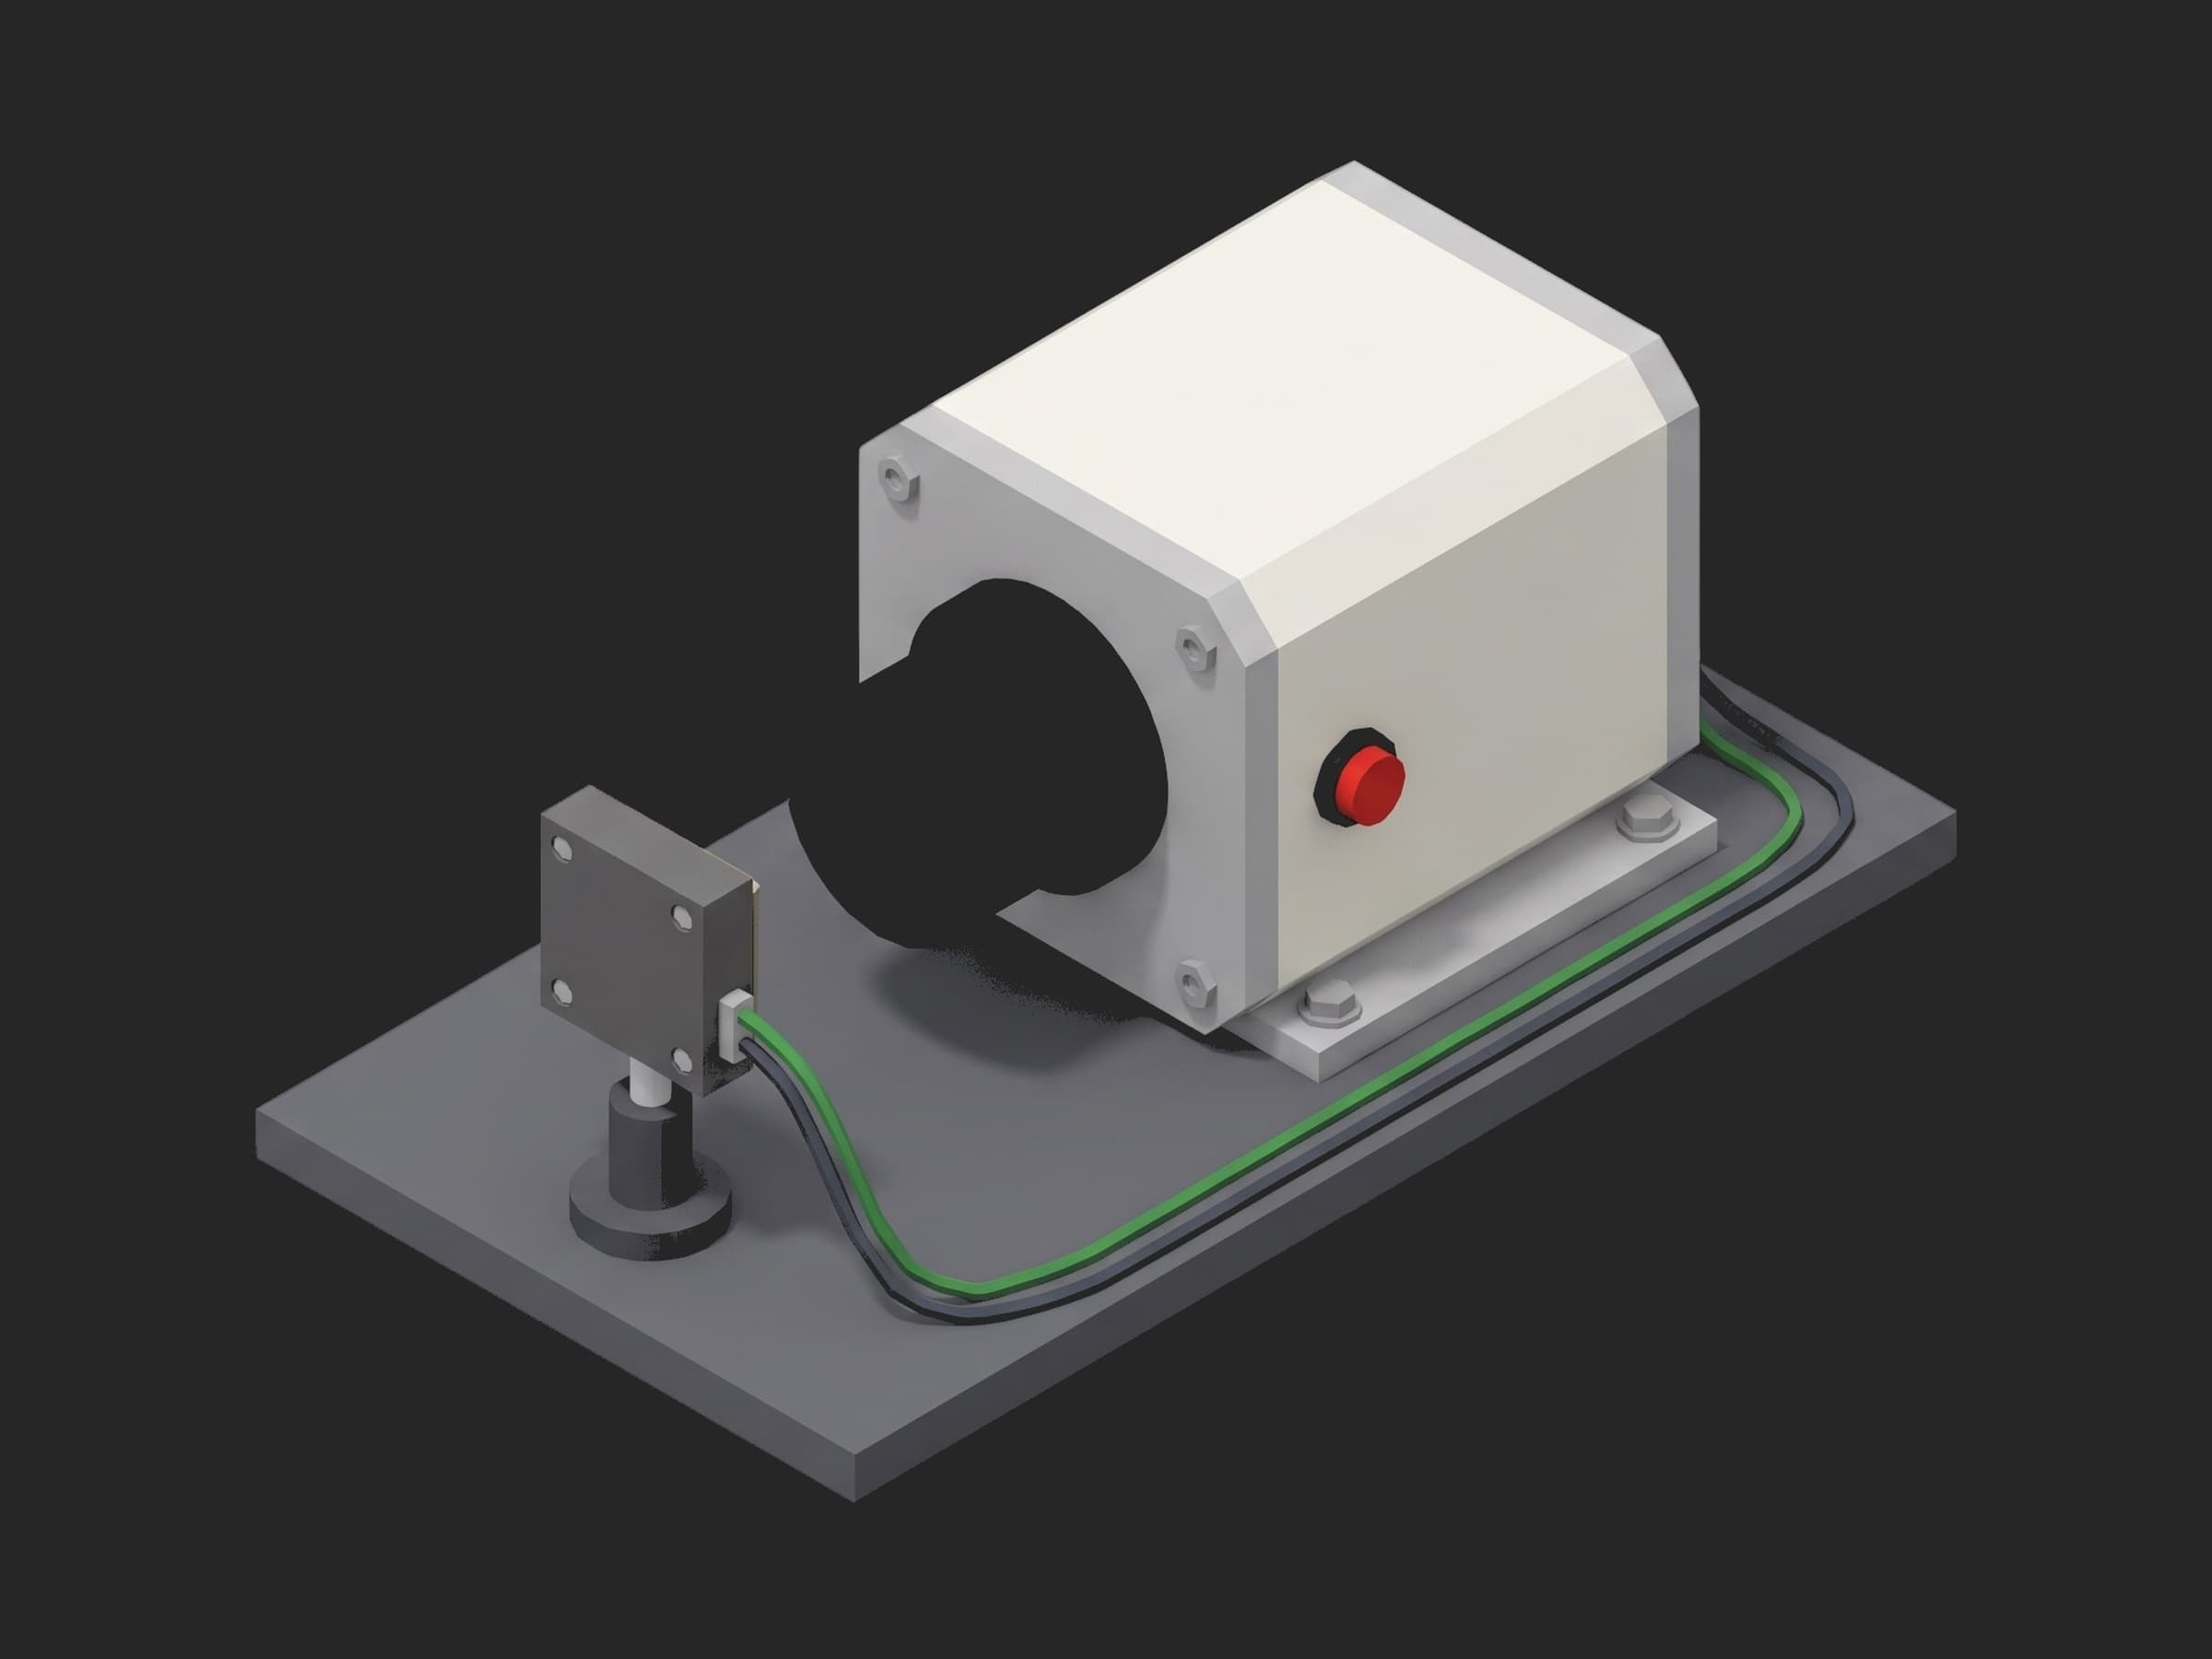
The unit on the chamber plate with the TQCM's crystal head on its post, facing the lens. The crystal is held cold so that whatever condenses on the optics also condenses on it, and its resonant frequency drops in proportion to the mass it collects.
The cycling is written down. ECSS-E-ST-10-03C Rev.1 asks for a pressure at or below 1e-5 hPa, four acceptance thermal vacuum cycles on a unit (eight for qualification), and a functional test at the hot and cold dwells (see ECSS-E-ST-10-03C Rev.1, Testing). The bakeout is not: no standard gives its duration, because it depends on what the unit is made of. It ends when the outgassing rate the witness sees falls under the programme's figure and stays there. A thermoelectric quartz crystal microbalance (TQCM) at its collection temperature reads that rate as a frequency slope in hertz per hour; on this programme the crystal at -20 °C must read under 1 Hz/h for the last six hours of a bake of at least 36 h at +60 °C, and the total frequency shift over the bake, the mass collected, has its own ceiling.
Test Purpose
The procedure records one thermal vacuum record per unit:
- Pump-down to the ECSS pressure, with the time it takes as a health figure for the chamber and for the unit's outgassing load
- Bakeout at +60 °C with the TQCM at -20 °C facing the unit: the frequency curve, the rate derived from it, the clean window at the end and the total mass collected
- Four acceptance thermal vacuum cycles with the tracker powered, its temperature logged, and at every hot and cold dwell the centroid error on a simulated star projected through the chamber window and the bus power
- Backfill with dry nitrogen, gated on the unit being above the room's dew point so the lens does not fog
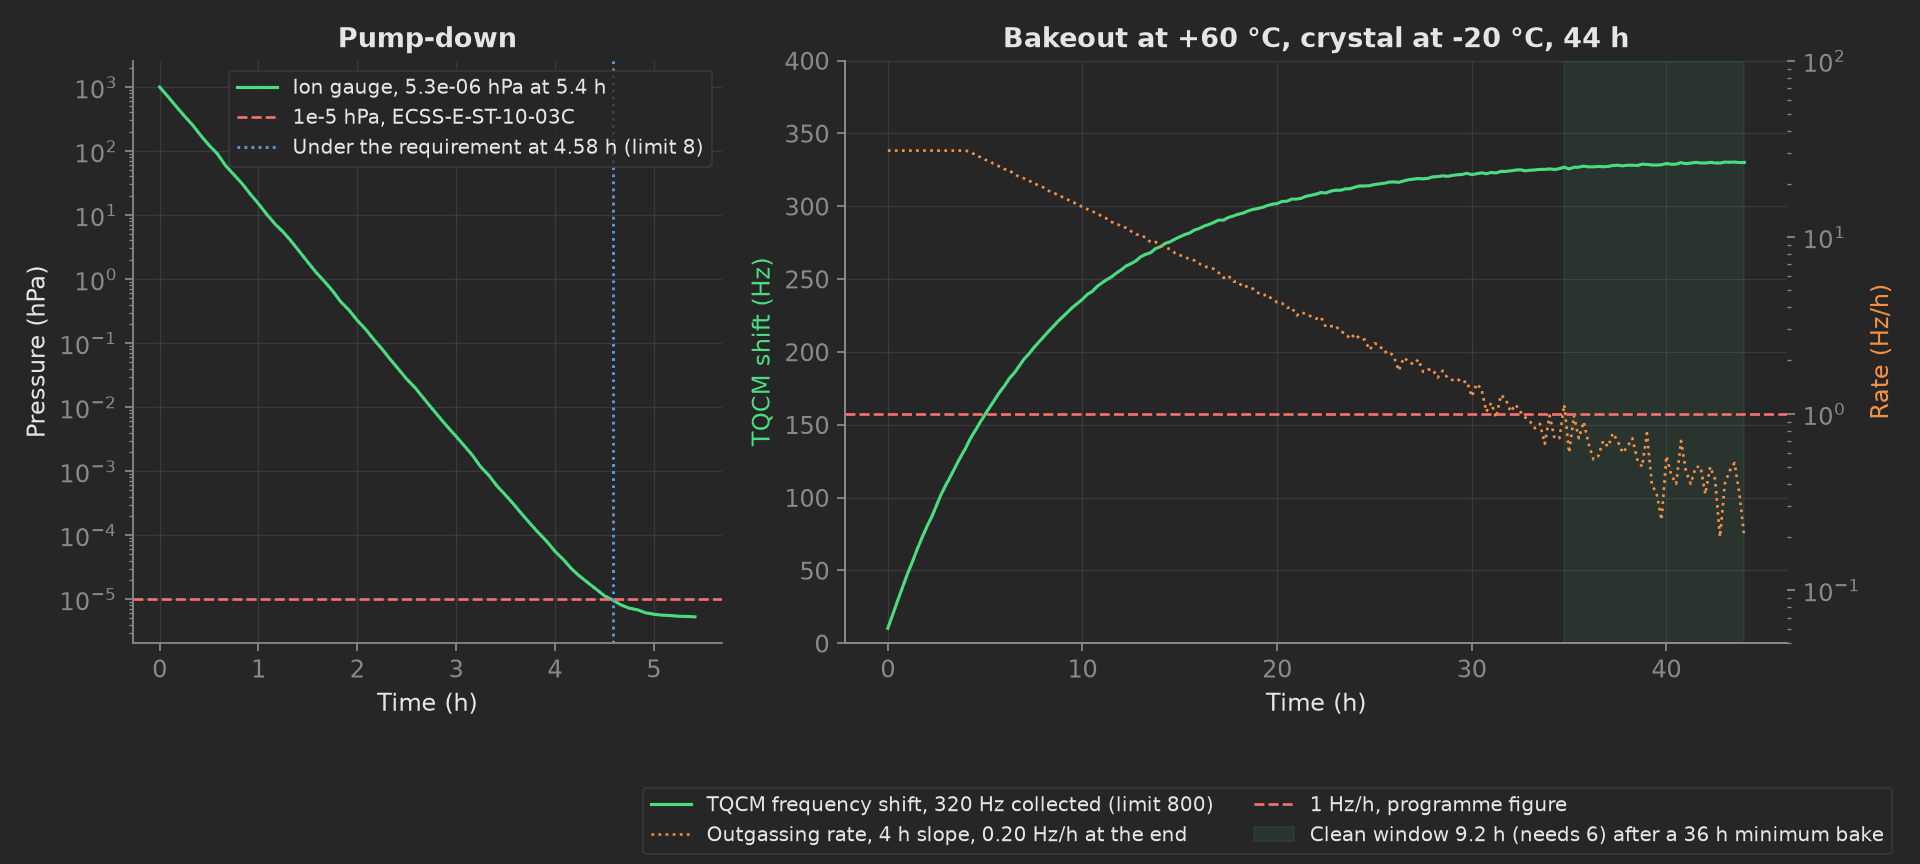
The mock unit's pump-down and bake: under 1e-5 hPa in 4.6 h, then 44 h at +60 °C during which the crystal collected 320 Hz while the rate decayed from 40 Hz/h to 0.2 Hz/h, clean for the last 9 h against the 6 h window. A unit with uncured potting or a contaminated harness keeps the rate above 1 Hz/h for days and hits the 72 h ceiling, which is a finding for the materials list, not a chamber problem.
The framework mechanics on show are a derived curve stored beside its raw one with the limits on the derivative, a duration window as two validators on one aggregation, a count validated with == beside a level validated as a window, a curve kept for the record with no aggregation next to two that are judged, very small numbers as limits, progress components on three time-scaled phases, and a teardown gate that protects the hardware.
Equipment & Setup
To run thermal vacuum on optical units, the following are required:
- A thermal vacuum chamber with a shroud, a temperature-controlled plate, a turbo pump and an ion gauge, and a window the star simulator can see through
- A TQCM on a cold finger, positioned to see the same surfaces the optics see
- A star simulator outside the window, a collimated point source the tracker can centroid
- The Device Under Test (DUT): a smallsat star tracker on its bracket, with its power and data harness through a feedthrough
- A TofuPilot Framework procedure to sequence the pump-down, the bake, the cycles and the backfill
- The TofuPilot Dashboard to keep the bake record per serial and trend the centroid error at the dwells across the lot
Hardware Components
Chamber, Pump and Gauge
A bench chamber with a shroud and a plate covers a unit this size. The chamber controller exposes the shroud and plate set points and the valves over Modbus; the ion gauge reports over RS-232. The pressure requirement is ECSS's 1e-5 hPa; the time to reach it is not a requirement but a diagnostic the procedure records, because a chamber that used to pump down in four hours and now takes seven has a leak or a wet load.
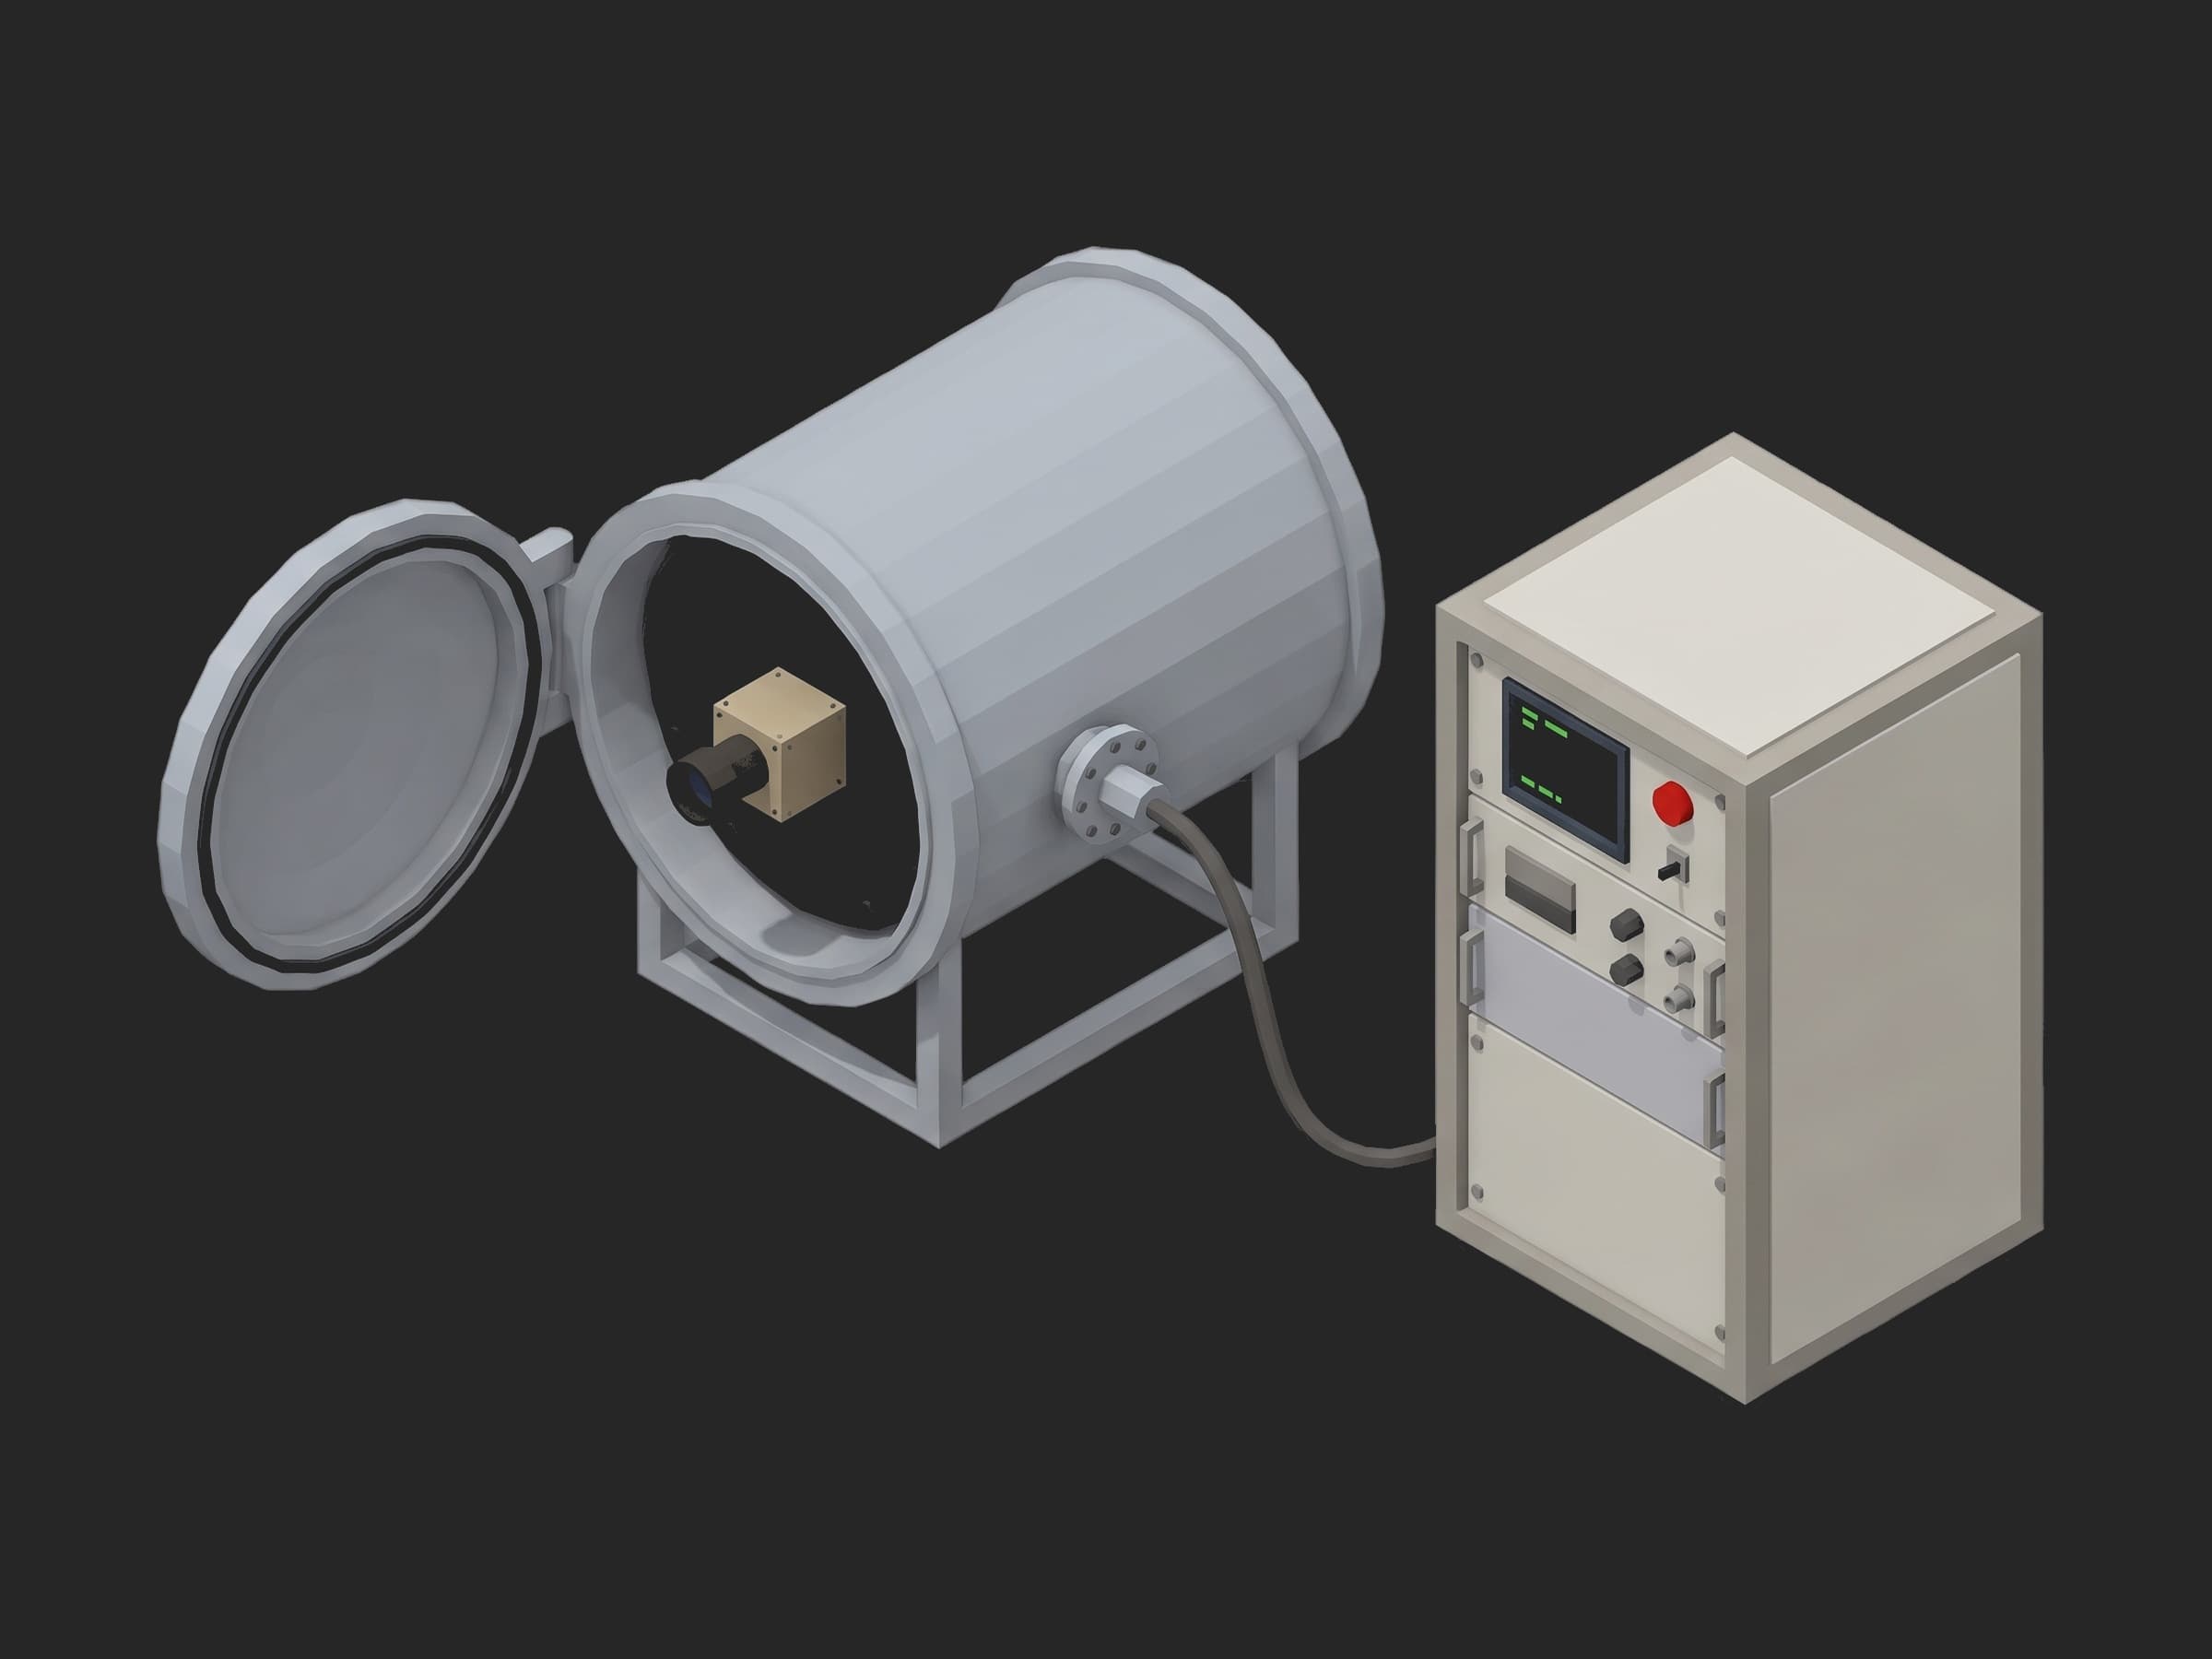
The bench with the door open for loading: the tracker on the plate inside, the rack with the chamber controller, the gauge and the QCM controller beside it, the harness through a flange.
TQCM
The witness is a quartz crystal held at a set temperature by a thermoelectric element, with its resonant frequency read by a controller of the CrystalTek or QCM Research class. Mass condensing on the crystal lowers the frequency; the procedure records the shift as a positive number. Two things matter: the crystal's temperature, which sets what condenses on it (on this programme -20 °C, cold enough to collect what would reach the lens), and its view, which must include the unit and not the chamber walls. The rate criterion and the total-shift ceiling are the programme's contamination control plan, and they are recipe constants here.
Star Simulator and Tracker Link
The functional check at each dwell is the tracker's own job: centroid a point source. A collimated source outside the window gives a star at a known angle, and the tracker reports the centroid over its Ethernet link along with its bus power and its temperature. The centroid error grows at the cold end as the lens contracts and the focus moves; the limit is the unit's own accuracy specification with margin.
Where the Limits Come From
The pressure and the four cycles are ECSS-E-ST-10-03C. The acceptance levels are the operating range, -25 to +50 °C, with a 5 °C margin. The bake temperature, the 36 h minimum and 72 h maximum, the 1 Hz/h rate at -20 °C, the 6 h clean window and the 800 Hz total shift are the programme's contamination control plan for an optical unit. The 10 arcsec centroid ceiling and the 3.5 W power ceiling are the tracker's data sheet. The 15 °C backfill gate is the room's dew point with margin.
Test Procedure
Overview
The procedure maps the run onto the framework's three stages. Identification lives in setup: with the chamber still at ambient. The three long phases are chained with depends_on because they share one chamber. The backfill lives in teardown: so the chamber comes back to air safely whether the run passed or not, and only once the unit is warm enough.
- Setup: firmware, unit temperature, chamber at ambient.
- Main: pump-down, pressure curve, time to vacuum.
- Main: bakeout, TQCM curve, rate, clean window, total shift.
- Main: four thermal vacuum cycles, profile, centroid and power at each dwell.
- Teardown: backfill with dry nitrogen once the unit is above the dew point.
Every metric validates against limits declared in procedure.yaml, and results stream to TofuPilot for per-serial trending across the lot.
Why TofuPilot Framework?
TofuPilot Framework is a YAML + Python test framework built for hardware manufacturing. Instead of writing all your test logic, measurements, and limits inside Python code, you describe what the test does in a procedure.yaml file, and how in small Python phase files. The framework handles:
- Automatic Python environment management (via
uv) - Operator UI (no frontend code needed)
- Measurement validation and live charts
- Process isolation between phases and equipment plugs
Project Structure
You can find the full source on GitHub. The TvacBench plug is a mock of the chamber, the gauge, the TQCM and the tracker's link together, synthesizing a healthy unit that pumps down to 5e-6 hPa in five hours, outgasses at a rate that decays from 40 Hz/h with an 8 h time constant, and centroids within 6 arcsec at the cold dwells, so the procedure runs end-to-end without a chamber or a unit connected.
tofupilot run .For CI or bench automation, the same run executes headless:
tofupilot run . --no-tui --no-kiosk --jsonThe Procedure File
procedure.yaml declares the unit, the bench plug, and the three stages with every measurement and limit:
procedure.yaml · 211 lines
name: TVAC Bakeout and Thermal Cyclingversion: 0.1.0description: Thermal vacuum run for a smallsat star tracker. Pump-down to the ECSS pressure, bakeout at +60 C with a TQCM witness judged on the outgassing rate and the mass collected, four acceptance thermal vacuum cycles with a centroid check on a simulated star at every dwell, and a dry-nitrogen backfill gated on the unit being above the dew point.unit: auto_identify: true serial_number: description: "Scan the tracker's label" placeholder: "ST-200-0000" pattern: "^ST-200-\\d{4}$" default_value: "ST-200-0088" part_number: default_value: "ST-200-FM" batch_number: default_value: "LOT-2026-09"plugs: - name: TVAC Bench description: "Chamber shroud and plate, turbo pump and ion gauge, TQCM on a cold finger, star tracker telemetry and image link (mock, one plug per chamber)" python: plugs.tvac_bench:TvacBench key: benchsetup: - name: Identify key: identify python: phases.identify measurements: - name: Firmware Version key: firmware_version validators: - {operator: matches, expected_value: "^3\\.\\d+\\.\\d+$"} - name: Unit Temperature Start key: unit_temp_start_c unit: °C validators: - {operator: ">=", expected_value: 18.0} - {operator: "<=", expected_value: 26.0} - name: Pressure Start key: pressure_start_hpa unit: hPa validators: - {operator: ">=", expected_value: 900.0}main: - name: Pump Down key: pump_down python: phases.pump_down timeout: 12h ui: components: - key: pump_progress type: progress label: "Pump-down" description: "To 1e-5 hPa" default_value: 0 max: 100 measurements: - name: Pump-Down key: pumpdown title: Chamber pressure during pump-down x_axis: legend: Time unit: h y_axis: - legend: Pressure key: pressure unit: hPa aggregations: - type: final_hpa unit: hPa validators: - {operator: "<=", expected_value: 1.0e-5} - type: time_to_vacuum_h unit: h validators: - {operator: "<=", expected_value: 8.0} - name: Bakeout key: bakeout python: phases.bakeout depends_on: [pump_down] timeout: 24h ui: components: - key: bake_progress type: progress label: "Bakeout" description: "+60 °C, TQCM at -20 °C, until the rate is clean" default_value: 0 max: 100 measurements: - name: Bake key: bake title: TQCM frequency, outgassing rate and unit temperature through the bake x_axis: legend: Time unit: h y_axis: - legend: TQCM frequency shift key: tqcm unit: Hz aggregations: - type: duration_h unit: h validators: - {operator: ">=", expected_value: 36.0} - {operator: "<=", expected_value: 72.0} - type: total_shift_hz unit: Hz validators: - {operator: "<=", expected_value: 800.0} - legend: Outgassing rate key: rate unit: Hz/h aggregations: - type: final_hz_per_h unit: Hz/h validators: - {operator: "<=", expected_value: 1.0} - type: clean_window_h unit: h validators: - {operator: ">=", expected_value: 6.0} - legend: Unit temperature key: unit unit: °C aggregations: - type: max_c unit: °C validators: - {operator: "<=", expected_value: 65.0} - name: TVAC Cycling key: tvac_cycling python: phases.tvac_cycling depends_on: [bakeout] timeout: 24h ui: components: - key: cycle_progress type: progress label: "Thermal vacuum cycling" description: "4 cycles, -30 to +55 °C, 2 h dwells, powered" default_value: 0 max: 100 measurements: - name: Profile key: profile title: Unit temperature through the four cycles x_axis: legend: Time unit: h y_axis: - legend: Unit key: unit unit: °C aggregations: - type: cycles validators: - {operator: "==", expected_value: 4} - type: min_c unit: °C validators: - {operator: "<=", expected_value: -29.0} - type: max_c unit: °C validators: - {operator: ">=", expected_value: 54.0} - {operator: "<=", expected_value: 58.0} - name: Dwells key: dwells title: Functional check at each hot and cold dwell x_axis: legend: Dwell y_axis: - legend: Temperature key: temperature unit: °C - legend: Centroid error key: centroid unit: arcsec aggregations: - type: max_arcsec unit: arcsec validators: - {operator: "<=", expected_value: 10.0} - legend: Power key: power unit: W aggregations: - type: max_w unit: W validators: - {operator: "<=", expected_value: 3.5}teardown: - name: Backfill key: backfill python: phases.backfill measurements: - name: Unit Temperature At Backfill key: unit_temp_backfill_c unit: °C description: Dry nitrogen only comes in with the unit above the room's dew point; a cold lens fogs. validators: - {operator: ">=", expected_value: 15.0} - name: Pressure End key: pressure_end_hpa unit: hPa validators: - {operator: ">=", expected_value: 900.0}Framework features to notice:
- A derived curve beside the raw one.
bakerecords the TQCM frequency as read and the outgassing rate the phase derives from it over a 4 h window; the limits sit on the rate'sfinal_hz_per_handclean_window_h, and on the raw curve'stotal_shift_hz. The dashboard shows both. - A duration window.
bake.tqcm.duration_hcarries a>= 36and a<= 72: too short and the bake did not run long enough to mean anything, too long and the unit is outgassing more than its materials list allows. - A count and a level.
profile.unit.cycles == 4is the ECSS requirement as a number;max_cbetween 54 and 58 says the hot level was reached and not overshot. - A curve for the record.
dwells.temperaturehas no aggregation; it is there so the centroid and the power at each dwell can be read against the temperature they were taken at. - Very small numbers.
final_hpa <= 1.0e-5is a limit like any other; YAML reads the exponent. - A teardown that gates the hardware.
unit_temp_backfill_c >= 15is not about the unit's quality; it fails the run if the chamber was backfilled onto a cold lens, which is the one mistake the run cannot undo. - Phase timeouts cap at 24 h. The bake and the cycles are time-scaled in the mock; on real hardware each runs as daily segments of its phase or is read back from the chamber's logger.
Identify
The setup phase reads the tracker's firmware and temperature over its link and the chamber's pressure at ambient, and records the chamber on the unit metadata:
def identify(measurements, bench, unit, log): """Setup: tracker telemetry, firmware, chamber at ambient with the door closed, TQCM zeroed on the record.""" ident = bench.identify() measurements.firmware_version = ident["firmware"] measurements.unit_temp_start_c = ident["unit_temp_c"] measurements.pressure_start_hpa = ident["pressure_hpa"] unit.metadata["chamber_id"] = "TVAC-1" log.info(f"Star tracker {unit.serial_number}: fw {ident['firmware']}, {ident['unit_temp_c']} C, chamber at {ident['pressure_hpa']:.0f} hPa")Pump Down
One call returns the pressure curve; the phase records it and finds the time the pressure first went under the requirement:
import numpy as npfrom utils.recipe import P_VACUUM_HPAdef pump_down(measurements, bench, ui, log): """Pump-down to the ECSS pressure requirement; the time it takes is a health figure for the chamber and for the unit's outgassing load.""" cap = bench.pump_down() ui.pump_progress = 100 t = np.array(cap["time_h"]); p = np.array(cap["pressure_hpa"]) below = np.flatnonzero(p <= P_VACUUM_HPA) t_vac = float(t[below[0]]) if below.size else float(t[-1]) measurements.pumpdown.x_axis = cap["time_h"] measurements.pumpdown.y_axis.pressure = cap["pressure_hpa"] measurements.pumpdown.y_axis.pressure.aggregations.final_hpa = float(p[-1]) measurements.pumpdown.y_axis.pressure.aggregations.time_to_vacuum_h = t_vac log.info(f"Pump-down: {p[-1]:.1e} hPa after {t[-1]:.1f} h, under {P_VACUUM_HPA:.0e} hPa at {t_vac:.2f} h")Bakeout
The bench holds the plate at +60 °C and the crystal at -20 °C and returns the frequency curve once its own end criterion is met or the maximum is reached. The phase derives the rate over a 4 h window, finds how long the rate has been under the figure at the end, and records the total shift:
phases/bakeout.py · 33 lines
import numpy as npfrom utils.recipe import BAKEOUT_MAX_H, BAKEOUT_T_C, TQCM_CLEAN_WINDOW_H, TQCM_RATE_HZ_PER_H_MAXdef bakeout(measurements, bench, ui, log): """Bake at +60 C with the TQCM at -20 C facing the unit. The crystal frequency is the mass collected; its slope is the outgassing rate. The bake is judged on how long the rate has been under the programme's figure at the end, and on the total mass collected.""" cap = bench.bakeout(BAKEOUT_MAX_H) ui.bake_progress = 100 t = np.array(cap["time_h"]); f = np.array(cap["tqcm_hz"]) # Rate over a 4 h window, Hz/h, from the frequency curve. w = 16 rate = np.full(t.size, np.nan) rate[w:] = (f[w:] - f[:-w]) / (t[w:] - t[:-w]) rate_curve = np.where(np.isnan(rate), rate[w], rate) clean = rate_curve <= TQCM_RATE_HZ_PER_H_MAX # Clean window at the end: hours since the rate last exceeded the figure. dirty = np.flatnonzero(~clean) clean_h = float(t[-1] - t[dirty[-1]]) if dirty.size else float(t[-1]) measurements.bake.x_axis = cap["time_h"] measurements.bake.y_axis.tqcm = cap["tqcm_hz"] measurements.bake.y_axis.tqcm.aggregations.duration_h = float(t[-1]) measurements.bake.y_axis.tqcm.aggregations.total_shift_hz = float(f[-1] - f[0]) measurements.bake.y_axis.rate = rate_curve.round(3).tolist() measurements.bake.y_axis.rate.aggregations.final_hz_per_h = float(rate_curve[-1]) measurements.bake.y_axis.rate.aggregations.clean_window_h = clean_h measurements.bake.y_axis.unit = cap["unit_c"] measurements.bake.y_axis.unit.aggregations.max_c = float(max(cap["unit_c"])) log.info(f"Bake {t[-1]:.1f} h at {BAKEOUT_T_C:.0f} C: TQCM {f[-1] - f[0]:.0f} Hz collected, rate {rate_curve[-1]:.2f} Hz/h at the end, clean for the last {clean_h:.1f} h (needs {TQCM_CLEAN_WINDOW_H:.0f})")TVAC Cycling
One call returns the four cycles as a temperature curve plus the centroid error and the power read at each dwell. The phase counts the cycles as the smaller of the hot and cold dwells reached, records the profile, and writes the dwell readings as three curves against the dwell index:
phases/tvac_cycling.py · 29 lines
import numpy as npfrom utils.recipe import CYCLES, T_ACC_MAX_C, T_ACC_MIN_Cdef tvac_cycling(measurements, bench, ui, log): """ECSS acceptance thermal vacuum cycling: four cycles between the acceptance levels, the tracker powered, a functional check at every dwell: centroid of a simulated star through the window, bus power.""" cap = bench.thermal_cycles() ui.cycle_progress = 100 u = np.array(cap["unit_c"]) hot = sum(1 for d in cap["dwell_temp_c"] if d >= T_ACC_MAX_C - 1.0) cold = sum(1 for d in cap["dwell_temp_c"] if d <= T_ACC_MIN_C + 1.0) cycles = int(min(hot, cold)) measurements.profile.x_axis = [round(m / 60.0, 2) for m in cap["time_min"]] measurements.profile.y_axis.unit = cap["unit_c"] measurements.profile.y_axis.unit.aggregations.cycles = cycles measurements.profile.y_axis.unit.aggregations.min_c = float(u.min()) measurements.profile.y_axis.unit.aggregations.max_c = float(u.max()) measurements.dwells.x_axis = list(range(1, len(cap["dwell_temp_c"]) + 1)) measurements.dwells.y_axis.temperature = cap["dwell_temp_c"] measurements.dwells.y_axis.centroid = cap["dwell_centroid_arcsec"] measurements.dwells.y_axis.centroid.aggregations.max_arcsec = float(max(cap["dwell_centroid_arcsec"])) measurements.dwells.y_axis.power = cap["dwell_power_w"] measurements.dwells.y_axis.power.aggregations.max_w = float(max(cap["dwell_power_w"])) log.info(f"{cycles}/{CYCLES} cycles, unit {u.min():.1f}..{u.max():.1f} C, centroid error up to {max(cap['dwell_centroid_arcsec']):.1f} arcsec, power up to {max(cap['dwell_power_w']):.2f} W at the dwells")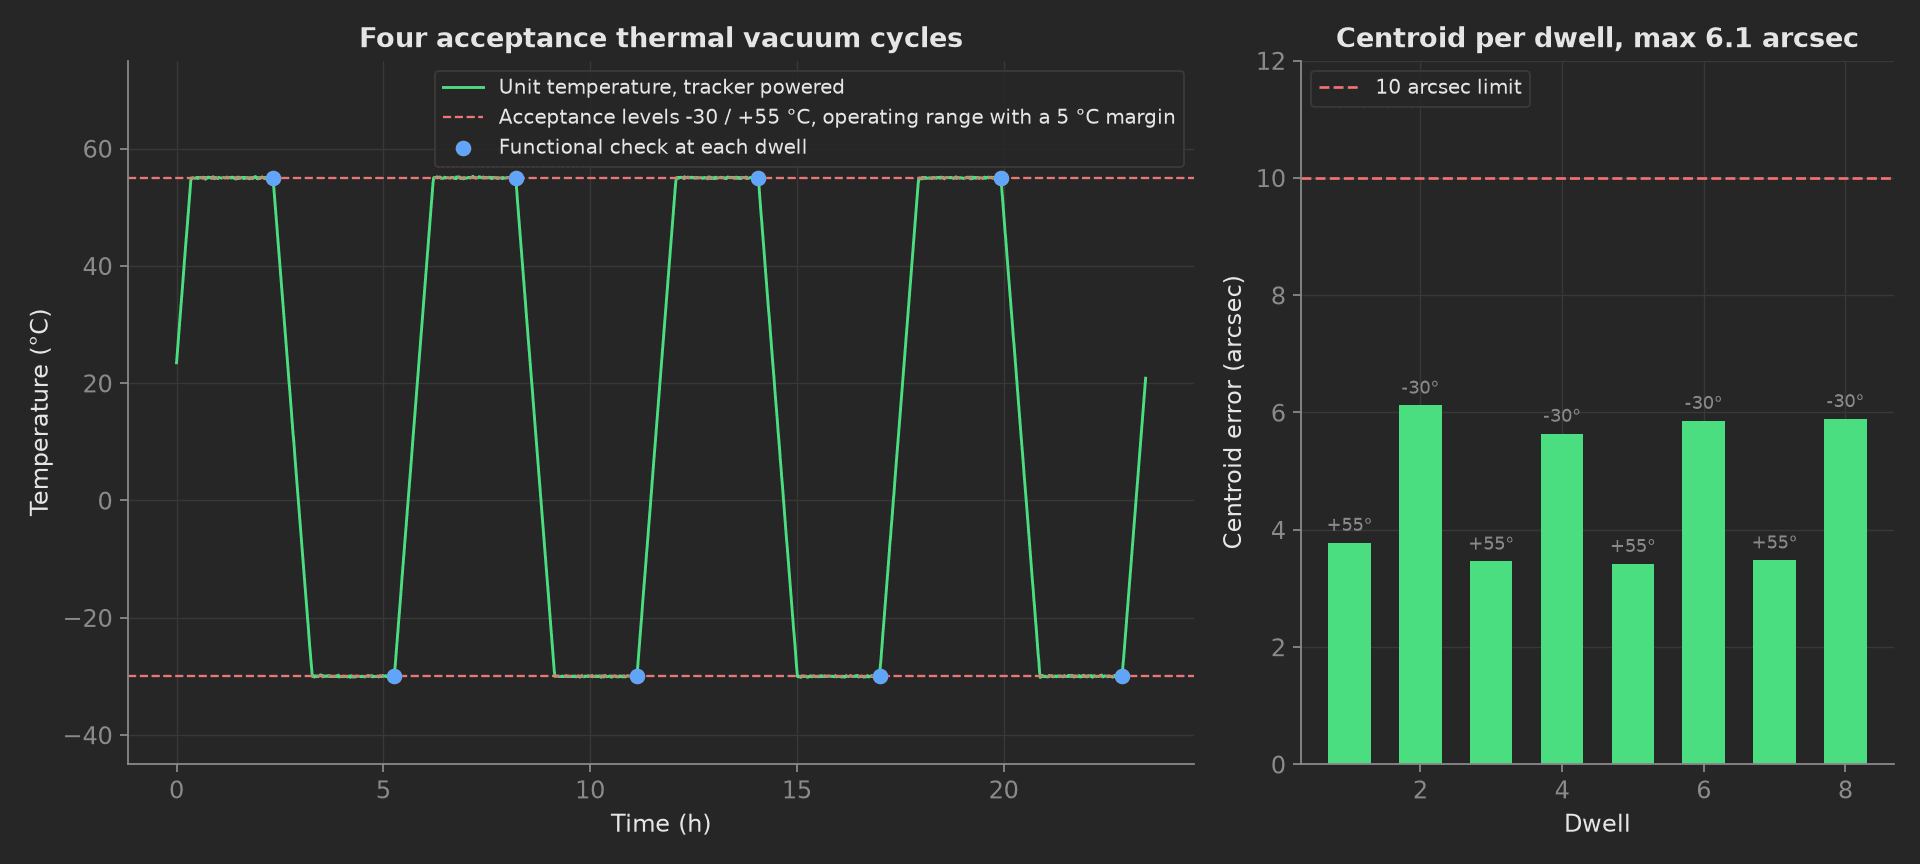
The mock unit's cycles: four between -30 and +55 °C with 2 h dwells, the centroid error 3.4 arcsec at the hot dwells and 5.6 to 6.1 arcsec at the cold ones as the lens contracts, against a 10 arcsec limit, and the bus power under 2.8 W throughout. A tracker whose focus was set at ambient and drifts past the limit at -30 °C is a unit for the optics bench, not the chamber, and this is where it shows.
Backfill
The teardown lets dry nitrogen in only once the unit is above the room's dew point, and records both the temperature at that moment and the pressure at the end:
def backfill(measurements, bench, log): """Teardown: the chamber is backfilled with dry nitrogen only once the unit is above the room's dew point; the optics must not fog.""" r = bench.backfill() measurements.unit_temp_backfill_c = r["unit_temp_c"] measurements.pressure_end_hpa = r["pressure_hpa"] log.info(f"Backfill at {r['unit_temp_c']} C on the unit, chamber at {r['pressure_hpa']:.0f} hPa")Mock Plug
TvacBench stands in for the chamber controller, the ion gauge, the QCM controller and the tracker's link. It draws a pump-down that decays to 5e-6 hPa in five hours, a bake whose outgassing rate starts at 40 Hz/h and decays with an 8 h time constant toward 0.15 Hz/h, with the bench ending the bake eight hours after the rate first went clean past the 36 h minimum, four cycles at 1.5 °C/min with 2 h dwells and a centroid error of 3.2 arcsec plus 0.055 arcsec per degree below 20 °C, and a backfill at ambient. The long phases are time-scaled and return in one call each. Every method returns plain Python types because plug calls cross a JSON boundary; a measurement read back from measurements.<key> returns a proxy, so the phases keep locals for their log lines.
On a real station, the class speaks Modbus to the chamber controller for the shroud, the plate and the valves, reads the ion gauge over RS-232 and the QCM controller over its serial protocol, and talks to the tracker over Ethernet for power, temperature and the centroid of the simulated star. Set TIME_SCALE = 1.0 in utils/recipe.py, run the bake and the cycles as daily segments or read them back from the chamber's logger because a phase timeout caps at 24 h, and set the TQCM rate, window and total-shift figures to the programme's contamination control plan. The phases, measurements and limits stay the same.