Test Histograms
New test histograms, assembly history, and batch number support features.
We got amazing feedback on our August release, which introduced Test Step Analytics and Control Charts. In September, we doubled down to deliver our biggest release yet, packed with the features you’ve been asking for.
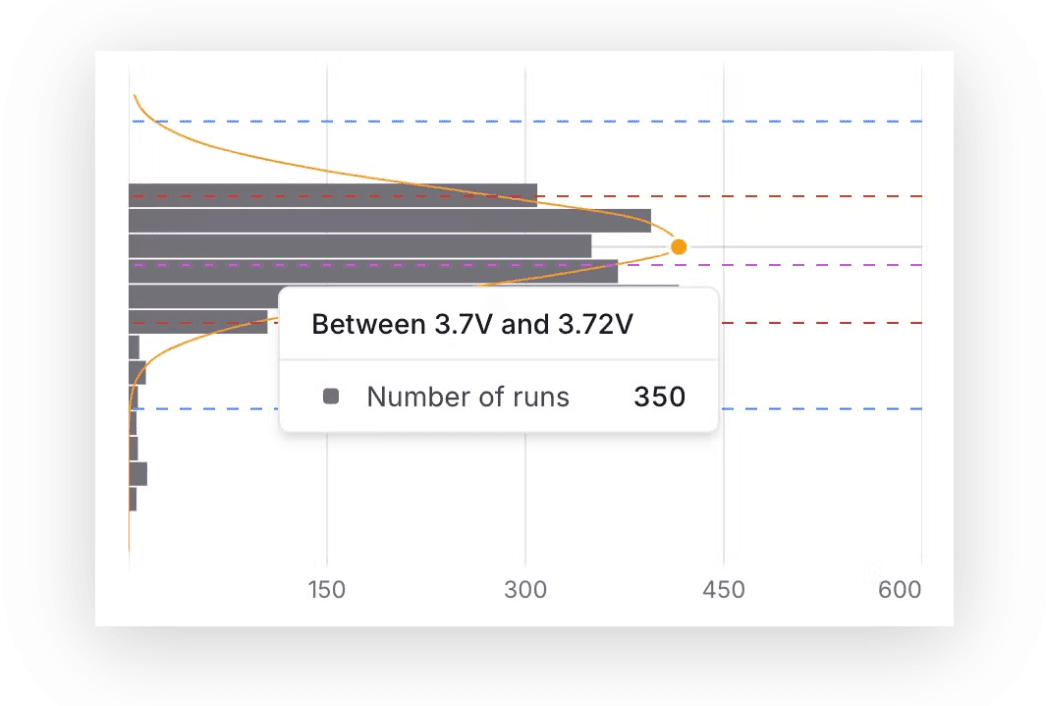
Visualize Distribution with Histograms
We’ve added a histogram next to the control chart for numeric steps. This lets you see the distribution of measurements across units and runs, and compare them with test limits and 3-sigma values.
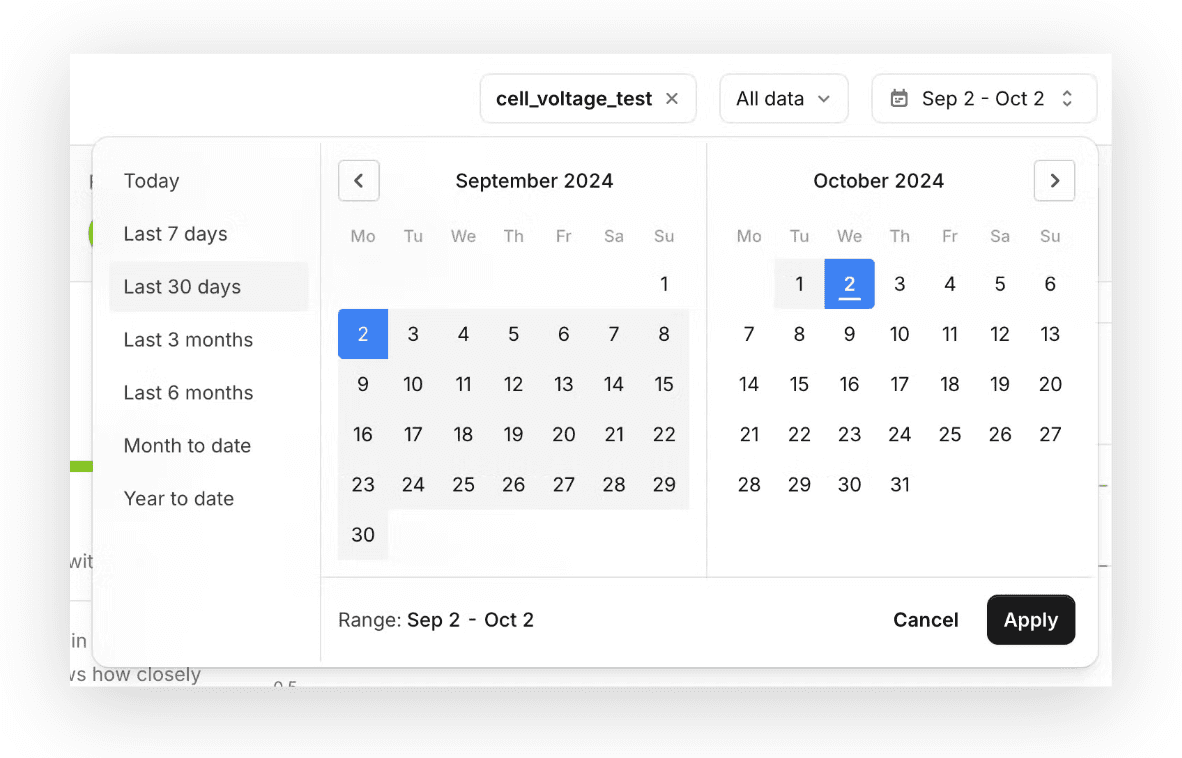
Date Filters for Time-Based Comparisons
You can now easily compare test results across different time ranges.
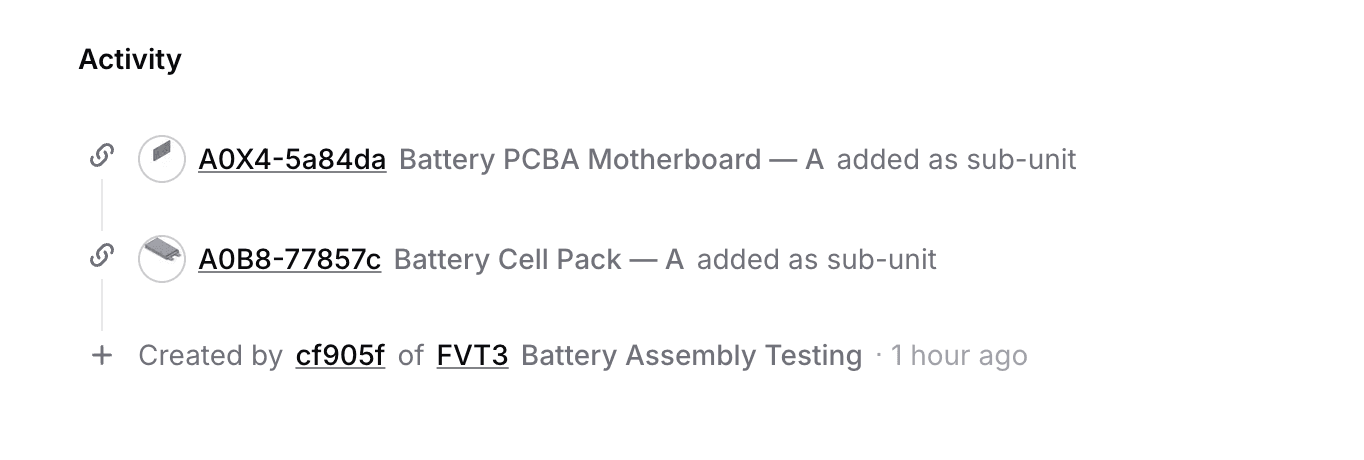
Track Sub-Unit Activity
You can now track any assembly or rework timeline with the new units activity panel. Operations are logged automatically from test runs or through new dedicated API endpoints.
Control Charts for String Steps
You can now log and track text-based measurements, such as firmware versions and component IDs, and visualize their distributions using new control charts designed specifically for string data.

Batch Number Support
You can now add batch numbers alongside unit serial numbers and compare test results between batches.

We’d love to hear your thoughts on these updates. For full details, you can check our Changelog.