Histograms, Assembly History, and Batches
October 3, 2024You asked for more analytics after our August release. Here's what shipped in September.
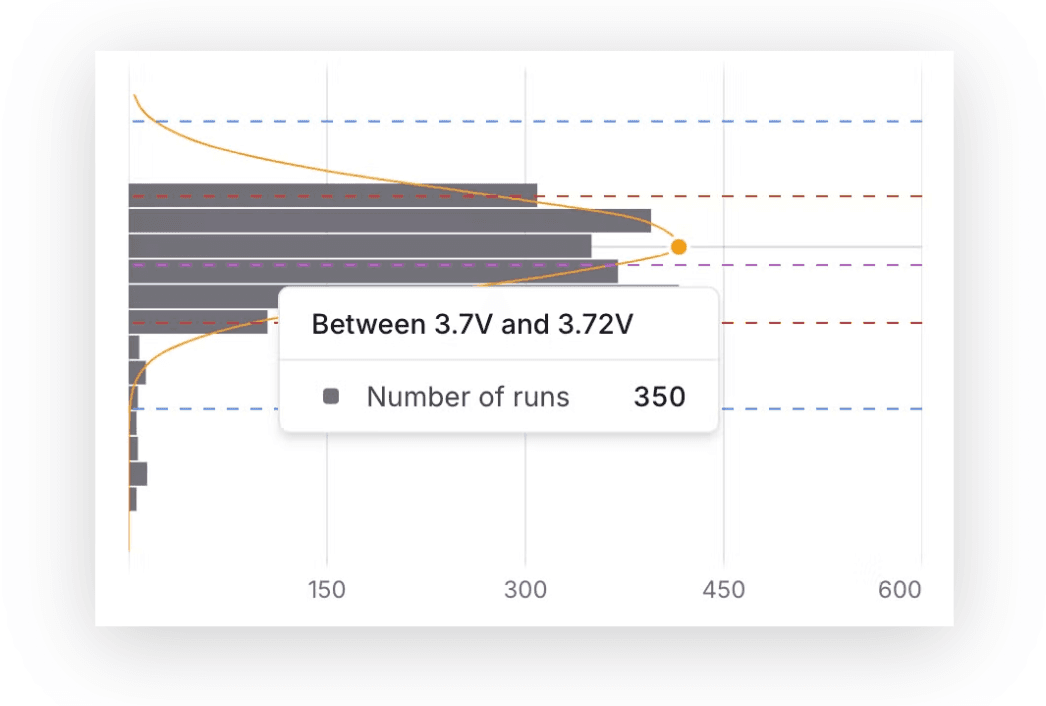
Visualize Distribution with Histograms
We've added a histogram next to the control chart for numeric steps. This lets you see the distribution of measurements across units and runs, and compare them with test limits and 3-sigma values.
No code changes needed. Histograms appear automatically for any numeric step.
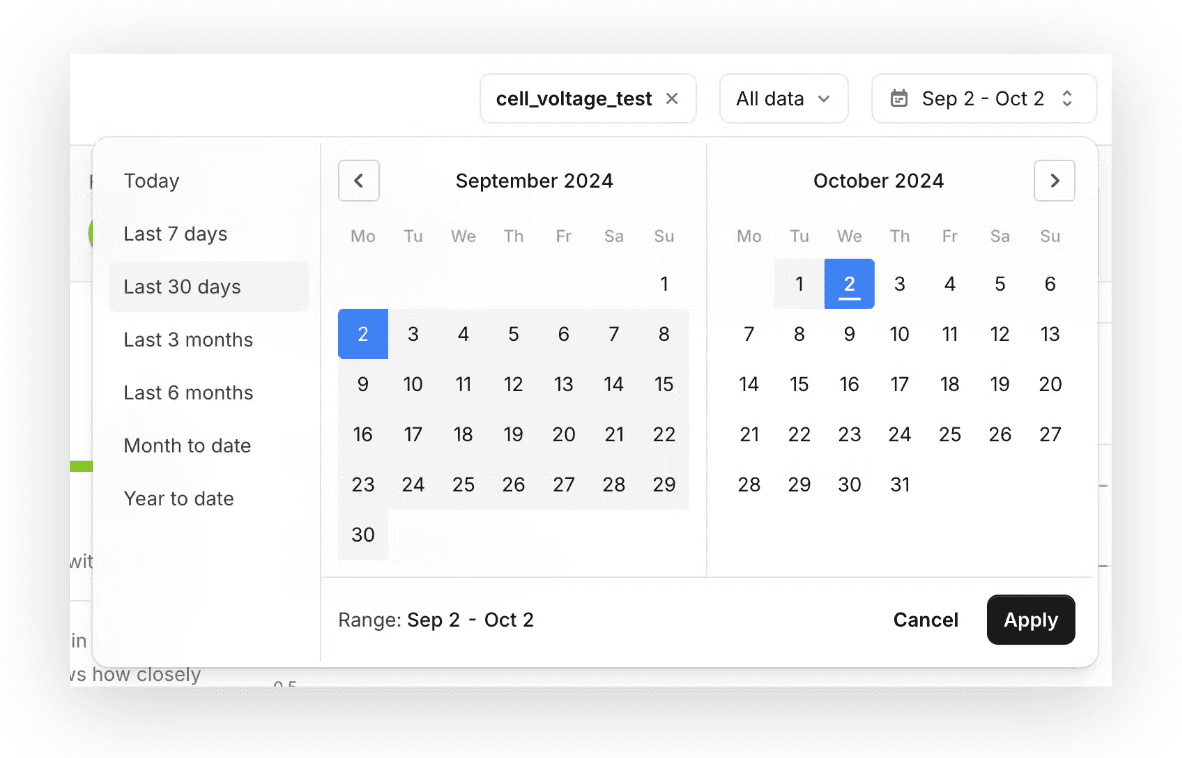
Date Filters for Time-Based Comparisons
You can now compare test results across different time ranges. Available on all analytics pages, no setup required.
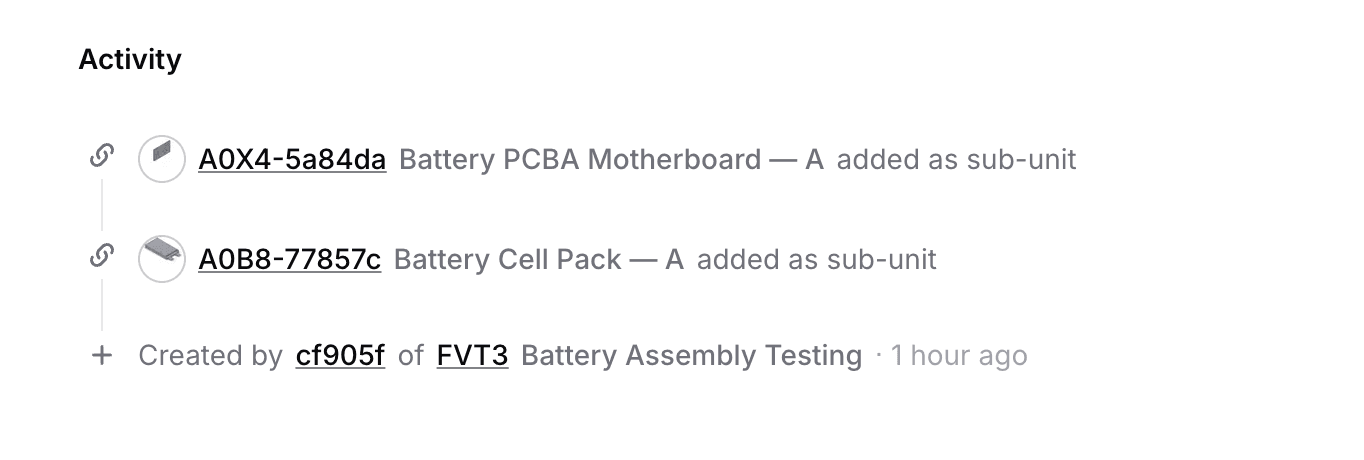
Track Sub-Unit Activity
You can now track any assembly or rework timeline with the new units activity panel. Operations are logged automatically from test runs or through new dedicated API endpoints.
Using the Python client? Pass sub_units in your create_run call. The activity panel populates automatically.
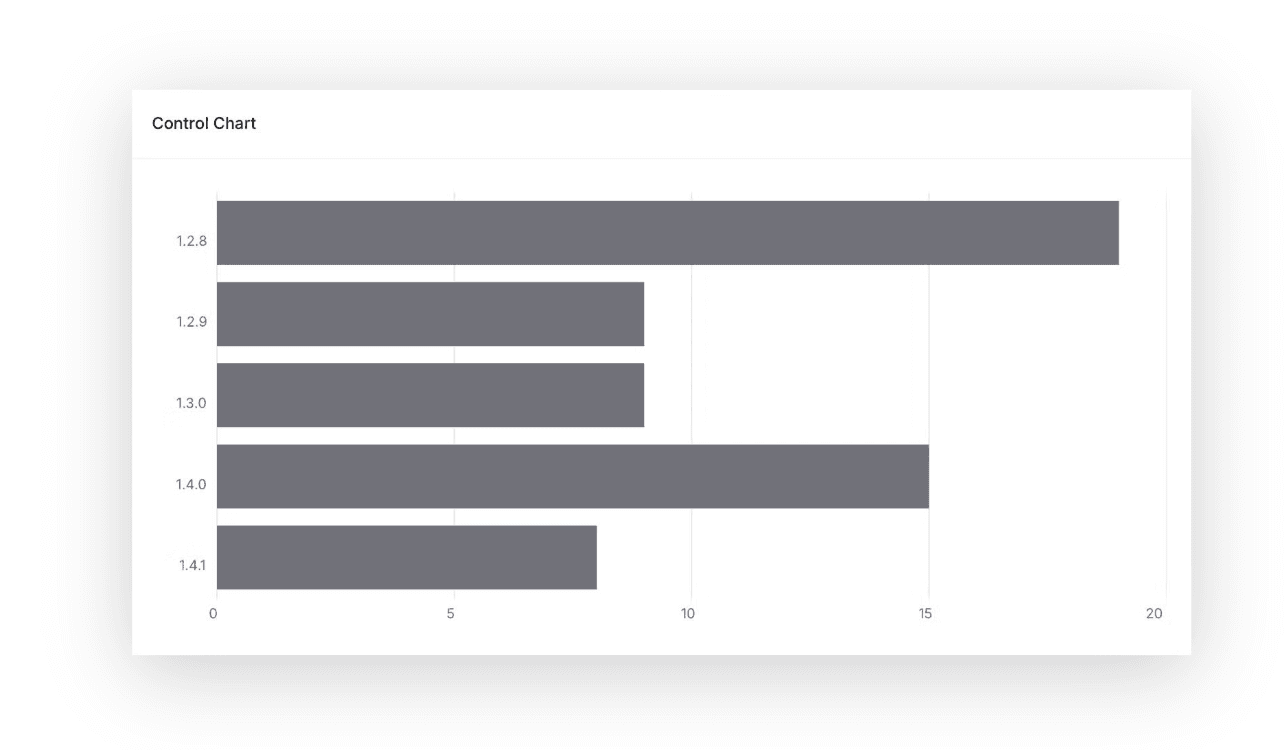
Control Charts for String Steps
You can now log and track text-based measurements, such as firmware versions and component IDs, and visualize their distributions using new control charts for string data.
These work the same way as numeric charts. Just pass string values in your measurements.
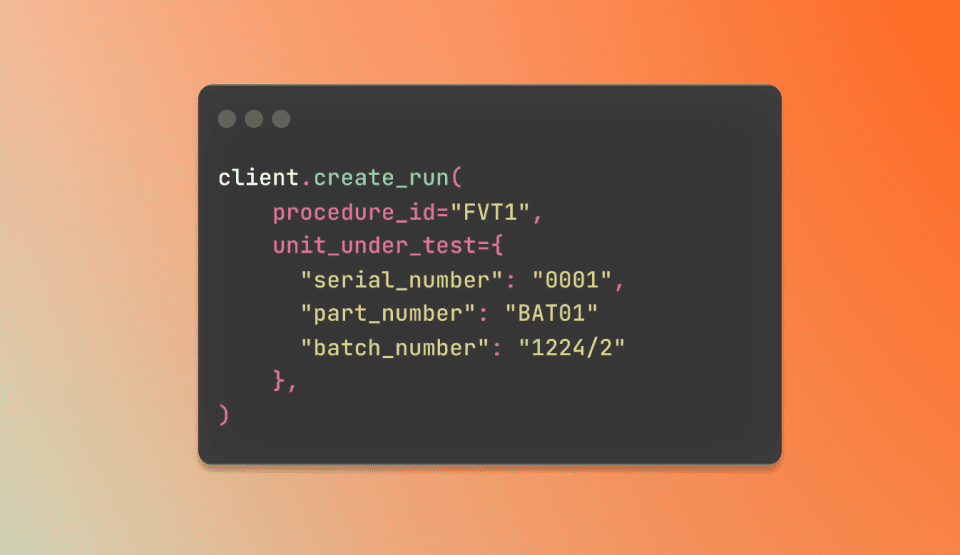
Batch Number Support
You can now add batch numbers alongside unit serial numbers and compare test results between batches. Just pass batch_number in your create_run call.
We'd love to hear your thoughts on these updates.